Is Market Participation A Warning Sign?
Happy Monday! Well, are Mondays really ever “happy”, especially such a nice weekend?
FYI, my publishing schedule may be a bit off over the next two weeks as I am traveling and trying to complete my Q2 report to clients following the webinar.
As you know I have been less bullish the last few posts, but not bearish. I think a 2-5% pullback is setting up this quarter. In all likelihood it will be one to buy. I have reviewed my four key sectors as well as the major indices. Nothing is flashing red at this point. In fact, I have written about the potential for small cap leadership which would be bullish for stocks. However, given the road rash and tire marks on my body from being run over so many times attempting this trade, I am only giving it a few percent to prove me wrong.
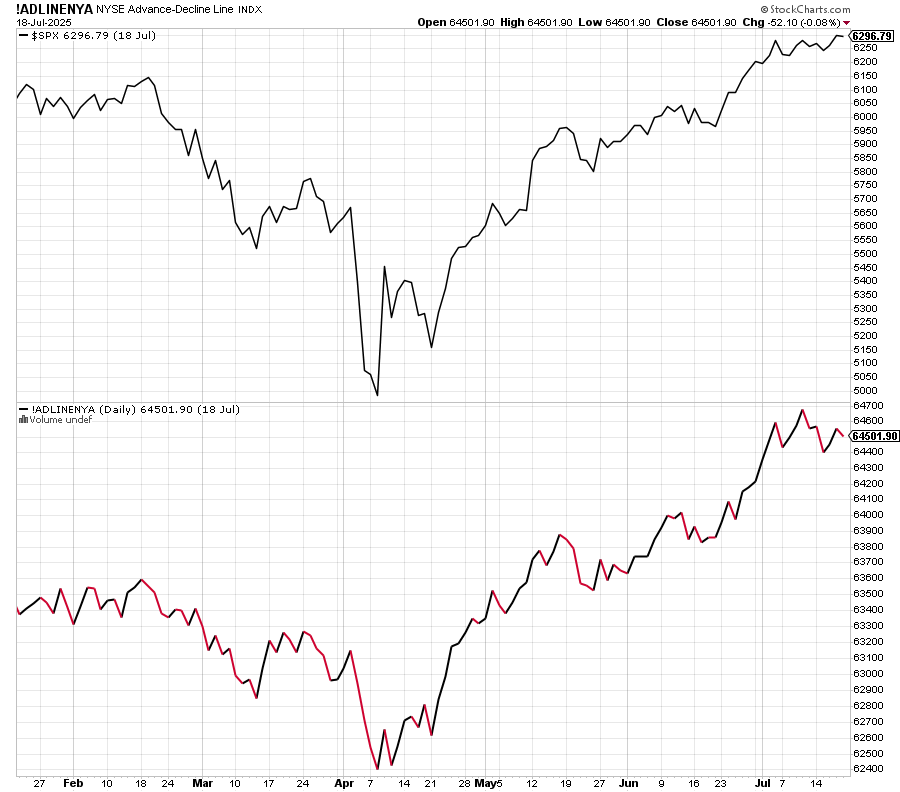
The chart below is one post a lot. It is the New York Stock Exchange’s Advance/Decline Line which simply measures overall participation. You want to see the NYSE AD equal to or stronger than the S&P 500. Lately, it has a touch weaker, but I am not worrying too much about something so short-term in this indicator. All seems okay.
Another way to view participation is watching the percent of stock in uptrends in the NYSE. Below, you can in the lower panel that only 56.45% of stocks are in uptrends while the stock market has soared to all-time highs. I definitely want to see that number above 60% and ideally above 70%.
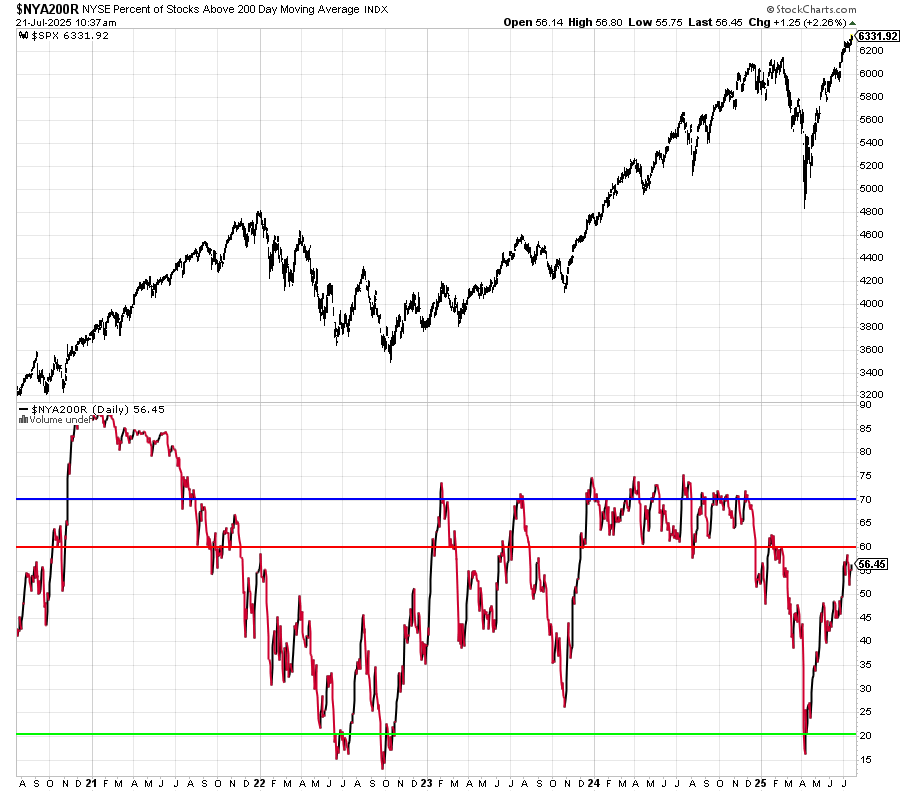
In essence, when this number falls below 60% as stocks rise to new highs, it is a warning sign to look elsewhere for additional confirmation of weakness. I would say that right now, it’s flashing yellow.
Stocks remain overbought. Sentiment is a wee too giddy as well. Momentum remains fairly strong, however. In simple words, I am dancing closer to the door than at any time over the past few months.
On Friday we bought FJUL, PZZA and TAN. We sold IYT and some LHX.
