2009 Still Giving Us Clues as Pullback Continues
After last Thursday’s drubbing, the bull did what they have done every time they have been threatened since the new bull market began in March. They rallied the stock market. On Friday, we saw a huge up opening that could not hold. Bears came in and sold the market into negative territory, only to see the bulls rally it back after lunch. This is classic sign of volatility and that there is a fierce fight going on.
There are still very few people calling this a new bull market as I have. Yes, it’s only a label and it really doesn’t matter what we call it, but I do think it is a sign of long-term sentiment. For a few weeks, I have pointed out that short-term sentiment had become almost frothy based on some indicators and my own anecdotal evidence. That finally manifested itself in this pullback. But remember, with so few recognizing the picture, it makes them look for much bigger declines than perhaps should occur in a bull market. In other words, while the “buy the dip” crowd may be loud, they may not get the magnitude they are looking for.
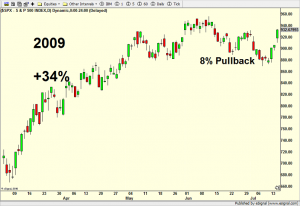
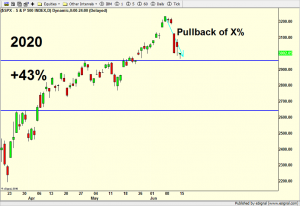
I wanted to update the charts below from last week where I compared 2009 to 2020 when new bull markets launched. I lined up the bottoms on the charts but let’s not forget that markets are trading faster today than in 2009 and things are more compressed today.
I would argue that today is similar to June 2009 in that the market is experiencing its largest pullback since the bottom. Of course, price behavior will diverge the longer we go into time, but it’s nice little analog, for now.