2022 Still Looking Like 2018 & 1994 – Details Below
As you know I have been viewing 2022 in the stock market as a challenging year, a frustrating year for both bull and bear alike. 2022 is a year that requires patience and quality, at least that was my theme as the year began and remains that way. By “challenging”, I do not mean like 2008, 2002 or 2001 which were years where few strategies worked and the indices were hit hard. No. I mean it is not going to be a fun year where we pat ourselves on the back or brag at cocktail parties (do we even have them anymore?) about the latest hot tech stock we bought.
Longtime readers know I am a huge student of market history and our database has inputs as far back as 1926, not that I find it remotely useful to draw on what happened 100 years ago. I do try to find modern analogs to the current market environment. Remember, history tends to rhyme rather than repeat, something that should never be forgotten as investors.
I have often commented that 2022 could or should look a lot like 1994, 2015-2016 or 2018, all years where the Fed was aggressively tightening monetary policy. I thought it would be fun and interesting to compare the first three months of 2022 with some of those other years.
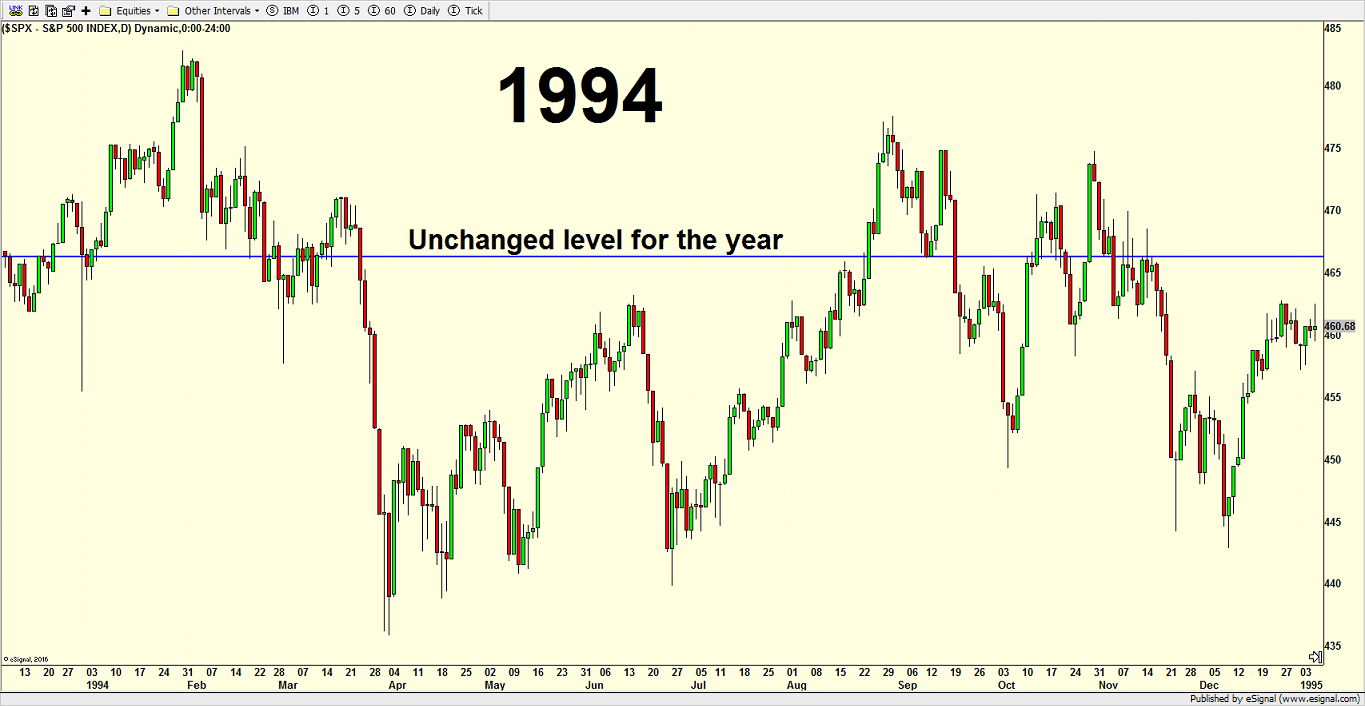
Note that each chart has a blue, horizontal line which depicts the closing price of the previous year. In other words, the unchanged level on the current year where the stock market’s return is 0%.
Let’s start with 1994 which felt a whole lot worse at the time than as I look back now. There was epic greed and euphoria in January and it seemed way too easy to make money. Then Alan Greenspan threw cold water on the market on February 4th. I remember being slow to react until the little rally in mid-March. The stock market spent the year oscillating around the flat line. Each time sellers drove the S&P 500 between 435 and 445, buyers stepped up in a huge way. Keep that theme in the back of your mind.
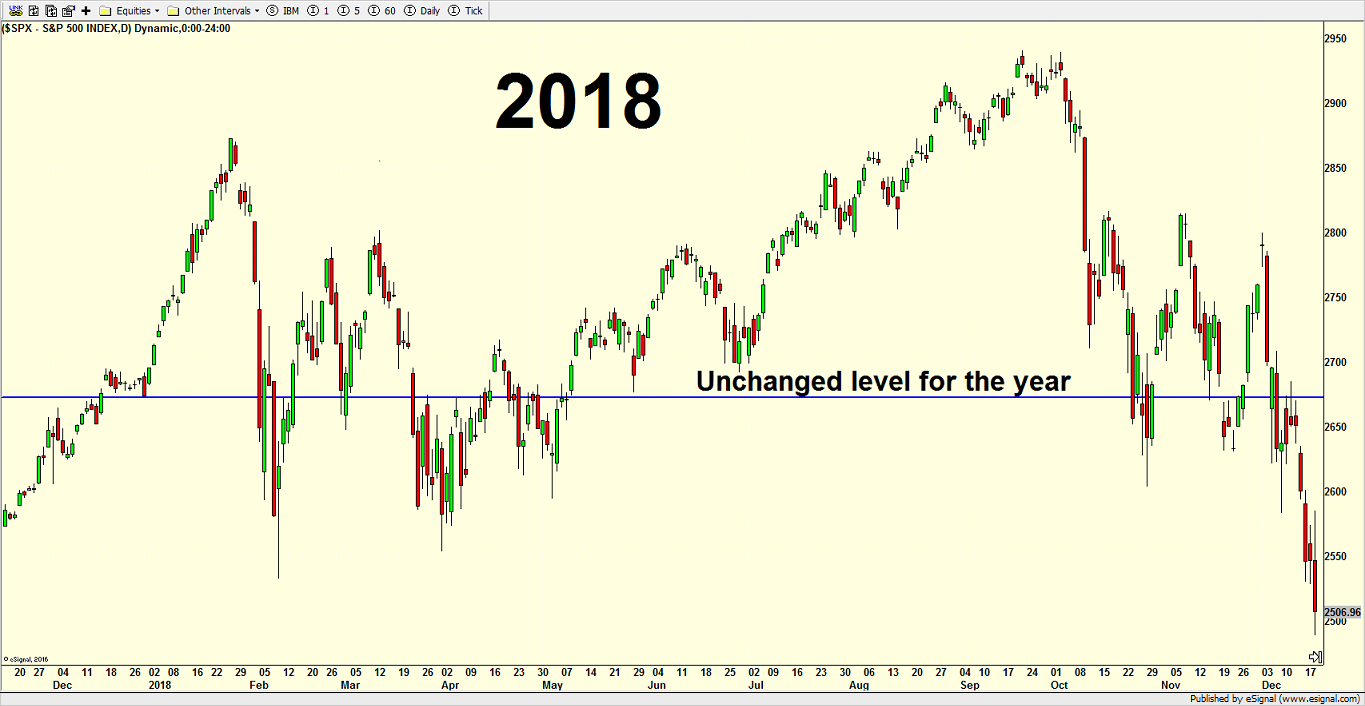
2018 is next and below. Very similar to 1994, the year began with epic greed and euphoria. It felt almost as crazy as the Dotcom Bubble. While the decline in 1994 was just about 10% at its worst, the Q1 2018 decline immediately exceeded 10%. Similarly, both corrections saw the first leg down as having the most carnage. In 1994 the price low was April 4th and then we saw three more attempts lower in Q2 that all fell shy of that initial bottom.
In 2018 the price low was February 9th, also during the initial plunge with two more attempts lower that failed. Very similar declines. The unchanged level in 1994 was higher than 2018 but still very similar as the stock market oscillated around both.
So, going back to my theme of a year like 1994 and 2018, let’s turn to 2022. The stock market came into the year, just like 1994 and 2018, with epic greed and euphoria. I wrote about it for weeks leading up to January. And just like the those two prior years, early celebrations turned sour quickly as the reality of the Fed’s tightening hit home.
The first decline in 2022 bottomed on January 24th and that’s where the most carnage was seen across the stock market. The price low was February 24th on an intra-day basis or March 8th on a closing basis. In other words just like 1994 and 2018, the bottom has been complex.
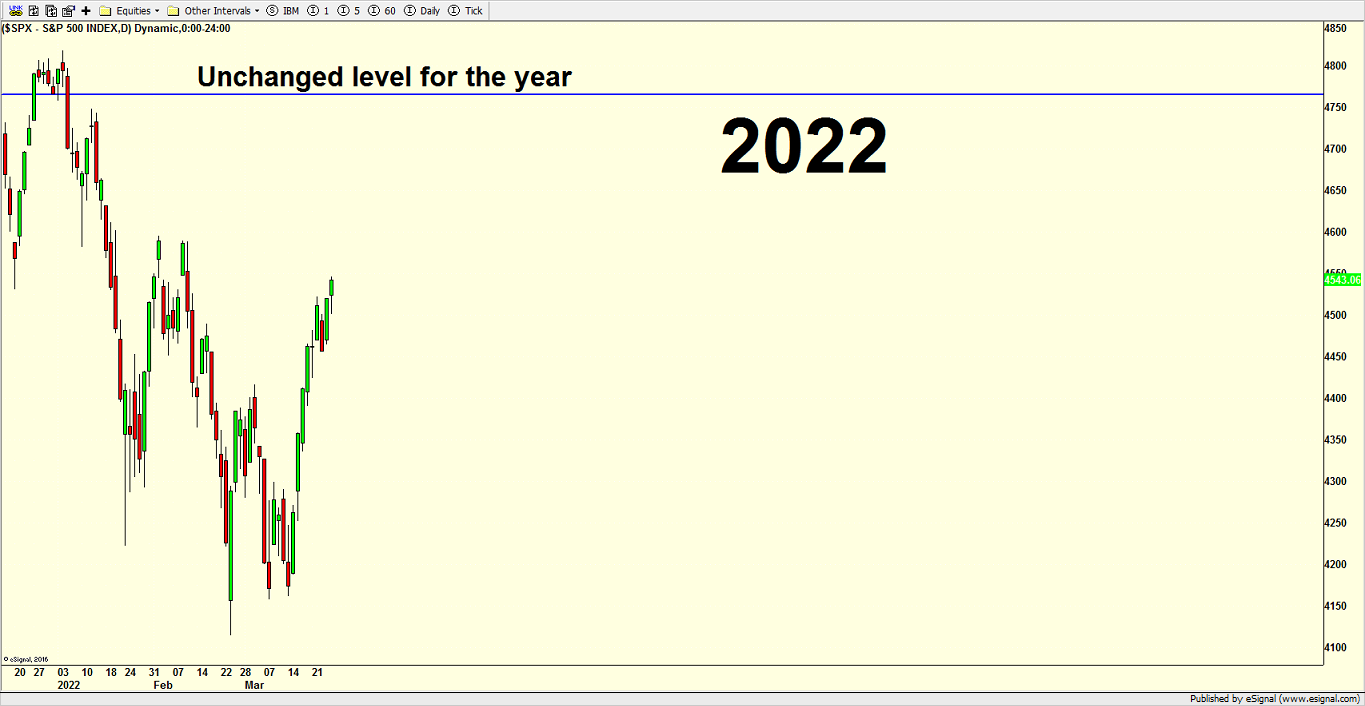
Stocks are now in the snap back or initial thrust phase off the low. To be crystal clear, I do not expect the stock market to get significantly above the blue, horizontal, unchanged line during the first half of the year. If that scenario is in the cards, it should be a Q4 story. Before a curious mind asks, the reason is because stocks never got that far above to begin the year as it did in 1994 and 2018.
Remember, my outlook for the year in the most simplistic terms was down Q1, up Q2, down Q3 and up Q4. In the end stocks finish minus 5% to plus 6%. Now, for sure, the stock market is “borrowing” some of the Q2 upside I forecast in March. That’s okay.
In the very short-term the stock market has rocketed off the low and almost everything that fell the most is bouncing the most, exactly as I have diagrammed. While a small pullback is due, I do not expect it to be much more than a few percent tops.
On Friday we bought CING, more FREL and levered inverse NDX. We sold levered Russell 2000, KMB, MANH and some BMRN.
