Fed’s Arrogance Will Lead to Disaster for Economy
Stock Market Behavior Models for the Day
As with every Federal Open Market Committee (FOMC) statement day, there is a model for the stock market to follow pre and post announcement. Certain environments have very strong tendencies while others do not. Over the past few meetings, many of the strongest trends immediately before and after were muted except for a modest post FOMC trend last meeting which called for mild weakness the very next day. The S&P 500 lost 10 points or -0.40%.
After the stock market’s decline over the past two days, one FOMC trend said to buy yesterday’s close. That was a strong signal. I was really hoping for a lower opening today for a few reasons. First, the third straight lower open is usually a good buying opportunity in a bull market. Second, it would have triggered a number of bullish short-term studies for the next one to two weeks. Finally and most importantly, a lower open would trigger two of the most powerful FOMC trends to buy the S&P 500 at the open. As Robert Burns said “the best laid plans of mice and men often go awry”. Stocks seem poised to bounce back at the open rather than decline.
As with most statement days, the model for the day calls for stocks to return plus or minus 0.50% until 2:00 PM. There is a 90% chance that occurs. If the stock market opens outside of that range, there is a strong trend to see stocks move in the opposite direction until 2:00 PM. For example, if the Dow opens down 1%, the model says to buy at the open and hold until at least 2:00 PM.
The next model calls for stocks to close higher today and rally after 2:00 PM. That is usually a very strong trend, 80%+, especially after seeing weakness into statement day (today). Finally, assuming stocks close higher today, there is a trend setting up for a post statement day decline, but that is not a certainty just yet.
No Rate Hike But All the Wrong Moves for Yellen & Co.
This is Chair Janet Yellen’s final meeting as chairman as well as final meeting sitting on the FOMC. With the Fed raising interest rates only 6 weeks ago, today’s meeting should be very unexciting. The next real opportunity for a rate hike will come at the March meeting. Remember, the Fed forecast one to two rate hike in 2018. I continue to believe the risk is to the upside for three to four increases.
Remember the Tom Cruise movie, “All the Right Moves”? It was a football movie set in steel country PA with Cruise having to make a number of life decisions. Well, if the Fed’s plan was a movie, I would title it “All the Wrong Moves”. Their academic arrogance has sprung up again and it will not end well for our economy.
I want to stop for a moment and rehash an old, but still troubling theme. I am absolutely against the Fed hiking interest rates AND reducing the size of its balance sheet at the same time. It’s an unprecedented experiment and the Fed doesn’t have a good track record in this department. Pick one or the other. Stop worrying about ammunition for the next crisis. Given that the Fed has induced or accelerated almost every single recession of the modern era, I have no doubt that the recession coming before the 2020 election will certainly have the Fed’s fingerprints on it with their too tight monetary policy experiment.
Let’s remember that the Fed was asleep at the wheel before the 1987 crash. In fact, Alan Greenspan, one of the worst Fed chairs of all-time, actually raised interest rates just before that fateful day. In 1998 before Russia defaulted on her debt and Long Term Capital almost took down the entire financial system, the Fed was raising rates again. Just after the Dotcom Bubble burst in March 2000, ole Alan started hiking rates in May 2000. And let’s not even go to 2007 where Ben Bernanke whom I view as one of the greats, proclaimed that there would be no contagion from the sub prime mortgage collapse.
Yes. The Fed needs to stop.
Velocity of Money Most Important
Below is a chart I have shown at least quarterly since 2008. With the exception of a brief period from mid 2009 to mid 2010, the velocity of money collapsed. It’s still too early to conclude, but it does look like it stopped going down in 2017. In the easiest terms, M2V measures how many times one unit of currency is turned over a period of time in the economy. As you can see, it’s been in a disastrous bear market since 1998 which just so happens to be the year where the Internet starting becoming a real force in the economy. Although it did uptick during the housing boom as rates went up, it turned out to be just a bounce before the collapse continued right to the present.
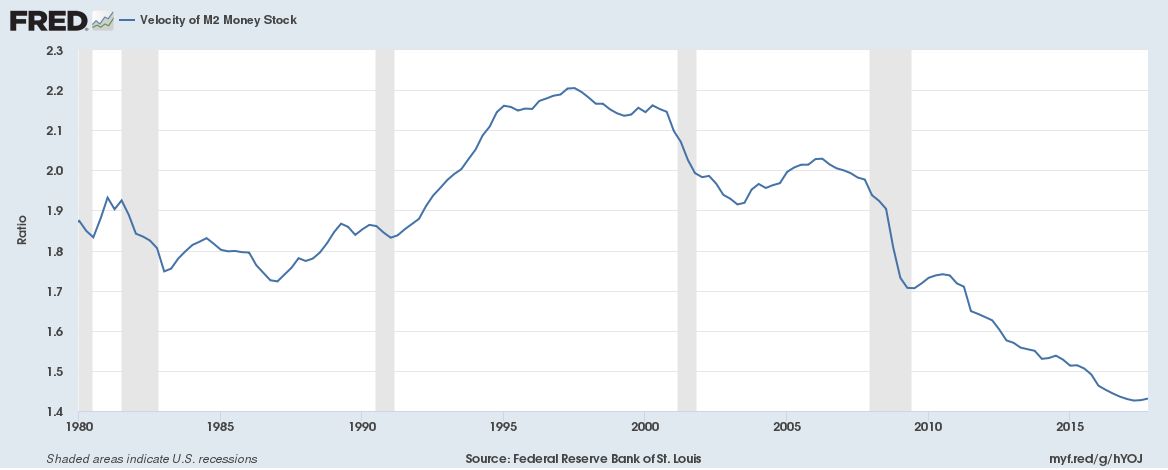
This single chart definitely speaks to some structural problems in the financial system. Money is not getting turned over and desperately needs to. The economy has been suffering for many years and will not fully recover and function normally until money velocity rallies. Without this chart turning up, I do not believe the Fed will create sustainable inflation at 2% or above. This is one chart the Fed should be focused on all of the time.
It would be interesting to see the impact if the Fed stopped paying banks for keeping reserves with the Fed. That could presumably force money out from the Fed and into loans or other performing assets. It continues to boggle my mind why no one calls the Fed out on this and certainly not Yellen at her quarterly press conference. In March, perhaps someone will question Chair Powell on this!
If you would like to be notified by email when a new post is made here, please sign up HERE
