Date: October 19, 2017
Anatomy of The Stock Market Crashes of 1929 & 1987. Can It Happen Today?
Today is the 30th anniversary of the stock crash of 1987. All week long there has been a stream of recountings, anecdotes and comparisons to today’s market. While I love nostalgia as much as anyone, there are almost no valid comparisons to 1987 and it’s pretty much a waste of time to take that argument. Writers, analysts and investors who insist that stocks are about to crash like 1987 are either perma-bears who have been wrong for the past 8 years, people trying to make a PR splash or just plain ignorant.
Real crashes are generational events. They are market events, not economic ones. We saw one in 1929 and not again until 1987. 2008 was absolutely not a crash. It took weeks, months and quarters to unfold and it was very fundamental with the financial crisis. Flash crashes in 2010 and 2015 were definitely not stock market crashes. Remember, 1987 saw more than 22% cut from stocks in a single day and more than 30% from high to low.
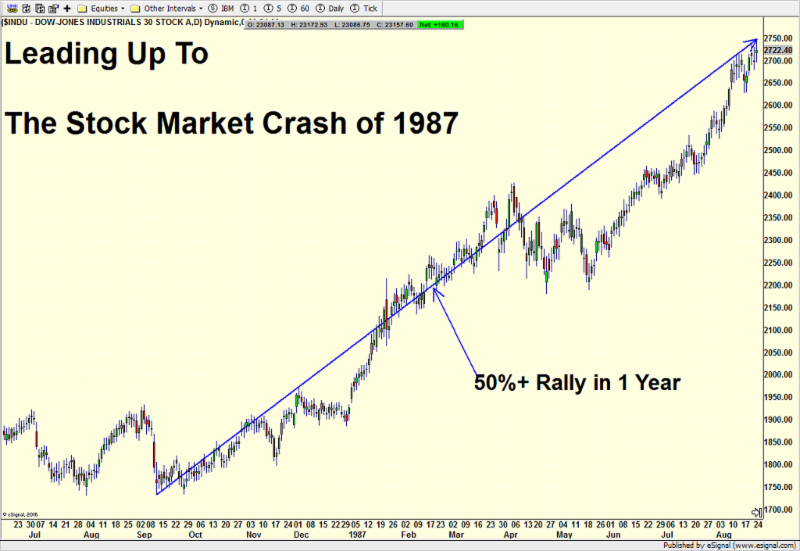
True crashes don’t just come out of the blue and they do not occur from all-time highs. My basic study of crashes concludes that an asset literally melts up into a peak before the seeds of a crash can be sown. By melt up, I am talking about an historic rate of return over the past 6-12 months. Look below at what happened in 1986 and 1987. The Dow surged 50%+ in less than a year.

In 1928 and 1929 the rally was even more vertical as you can see below although it’s a little more difficult to make out.


Stock market crashes are also preceded by a repeating topping pattern where price melts up to the final high. After that, what’s viewed as a normal and healthy 10% correction sets in over the next month or so. Stocks find their footing and rally to a secondary peak which is lower than the all-time high. You can see this just above on the right side of the chart in 1929.
It is from this peak that the snowball begins to head downhill. Snowballs typically grow and grow as they accelerate more and more until they are at their largest the split second before they hit the bottom.

Today, we have absolutely nothing that resembles the price action of 1929 or 1987. It’s idiotic to even try and make that case. If stocks crashed like they did previously, we would be looking at a decline of thousands of points in a single day. Additionally, stock market participation was very narrow in the months leading up to the crashes in 1929 and 1987. The final advances were both led by very few stocks with the vast majority already experiencing double digit declines well before the decimation was even seen. That’s certainly not the case today as the NYSE Advance/Decline Line just hit yet another all-time high as you can see below.

Finally, although crashes are not fundamental economic events, there are certainly triggers and accelerators. In 1987, newly appointed and among the worst Fed chairs ever, Alan Greenspan decided to sharply raise interest rates to fight an inflation problem that didn’t exist. Additionally, Treasury Secretary, James Baker, engaged in a war of words with the Germans over their currency and even went so far as to threaten to devalue the U.S. dollar. Lastly, the strategy du jour, portfolio insurance, somehow seemed like this brilliant idea where portfolio managers would use computer programs to sell stocks the lower they went. And the lower they went, the more stocks were sold. And on and on and on. Talk about insanely ludicrous!
One day, the stock market will be set up again for another great crash. But first, investors who lived through the previous one will likely have to be no longer involved or represent a tiny minority. Those who ignore history are doomed to repeat it, or at least watch it rhyme.
If you would like to be notified by email when a new post is made here, please sign up HERE

