And Another Round Of Bearish Indicators – Or Are They?
The past blogs I have discussed some negatives or warnings signs that have crept in the markets. Again, nothing big, nothing hugely vital. In the spirit of piling on, I will share two others today that have made the rounds for what seems like forever.
Pundits and analysts always talk about how important it is for rallies to have broad participation with the troops outpacing the generals. One way to analyze this is the chart (s) below. The first one pits the equal weighted S&P 500 (troops) against the cap weighted S&P 500 (generals).
When the line is rising, the troops are beating the generals which is supposedly a good thing. When the line is falling, the generals are leading which is said to be bad. Since late 2022 the generals led by Nvidia, Google, Microsoft and Amazon have overwhelmed the troops. Pundits continue to warn how worrisome that is.

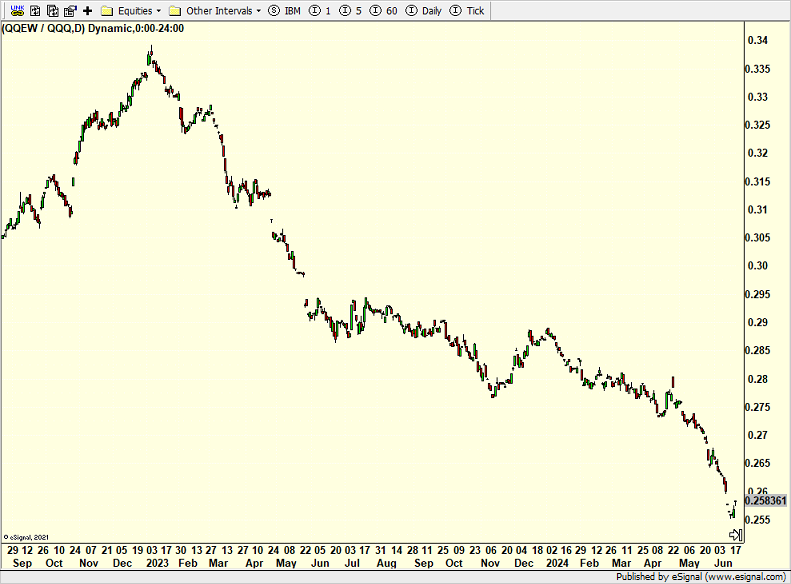
The chart below takes the same idea from above but focuses on the NASDAQ 100 instead of the S&P 500. The NASDAQ 100 is even more cap weighted to the generals and even more focused on the mega cap tech stocks.

In both charts the generals have crushed the troops for roughly 18 months as bearish pundits cry about the bear market coming although for much of 2023 they argued that the 2022 bear market never even ended. Intuitively, those pundits are correct, but reality doesn’t always follow the textbooks. One day it may matter, but this cause for concern is certainly not timely and cannot be relied on in managing portfolios.
On Friday we bought RYAVX, RYZAX and more TSLA. We sold BALT, RYAWX, RYBHX, RYWAX and some levered NDX.

