Bulls & Bears Draw Lines in the Sand
Stocks ended last week with a three day rally that looks to be built upon this morning. The major indices continue to trade in the range I outlined several weeks ago as the likely first bounce. What I did not envision was stocks getting into that range and then essentially going sideways. Historically, that has bullish implications.
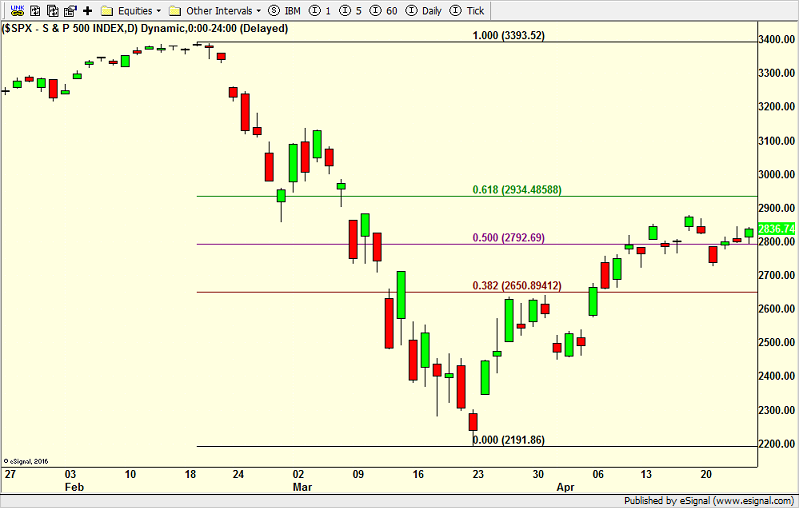
The first chart below is the S&P 500 on a daily basis so you can see the first bounce range of between 1/2 and 2/3s of what was lost during the crash. If stocks ready to new post-crash highs, the upside target would then be 2950 to 3000.
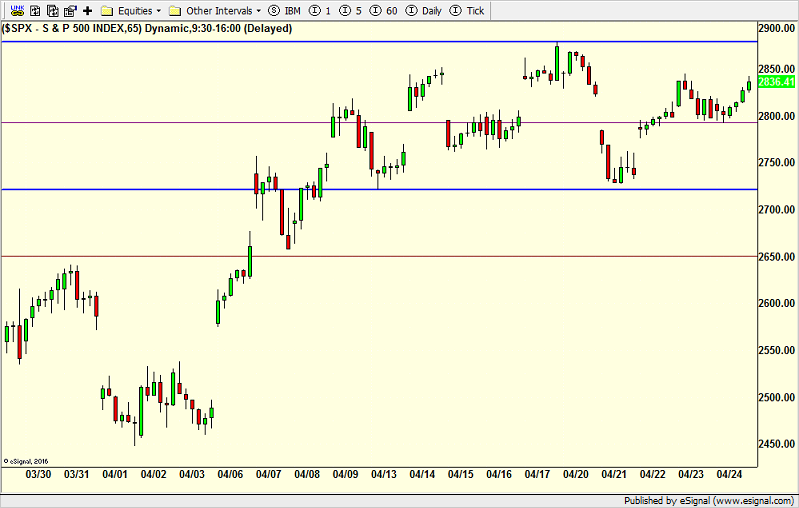
The next chart is the same S&P 500 but on an hourly basis so you can see the short-term range depicted by the two horizontal, blue lines. It should be easier to break above than below the range, however we should be on guard that a false move is always possible, but especially so now.
Finally, crude oil is under attack again, but notice in the pre-market that the stock market is shrugging it off. I heard a Congressmen speak this morning about oil being very low for a long, long period of time and that sellers will come in anytime it rallies. While that may make intuitive sense, it also speaks volumes about the sentiment in oil. This is how bottoms are made, when no one thinks something can rally.
