Canaries in the Coal Mine Part I – The Major Indices
For the past month, four of the five major indices have been in pullback mode after three of the five spent the previous month digesting gains from the huge post-BREXIT rally. While that theme continues today, I think the market is getting closer to resuming its uptrend with the Dow heading to 19,000.
Turning to the purpose of this article, I am going to first go through the major indices in the context of canaries in the coal mine to see what kind of shape they are in for the long-term. Then we will look at the four key sectors before finishing up with the NYSE A/D Line and high yield bonds.
For those new to my semi-regular canaries in the coal mine pieces, it’s my way to gauge the health of the bull market over the long-term. The stock market has corrected, 10%, 15% and even 20% without warnings from the canaries, but the canaries have always caught big bear markets. When we saw 10-20% bull market corrections, the canaries just tell us that the bull market isn’t over and to expect new highs at some point. This was the case during the 10-20% corrections in 2010, 2011, 2015 and 2016. And they were right each time.
The canaries did a very good job of warning about 2000 as well as 2008, however, keep in mind that they may give a few false warnings before the real one hits. It’s not a trading system and it really only matters when certain indicators are making new highs while others aren’t. I typically combine this with some really big picture indicators, like margin debt and sentiment, to fully gauge whether stocks are healthy or warning of a new bear market.
With all that said, let’s look at the major stock market indices. The Dow Industrials are first and you can see that along with the S&P 500 in the second chart, both saw their most recent highs in August.


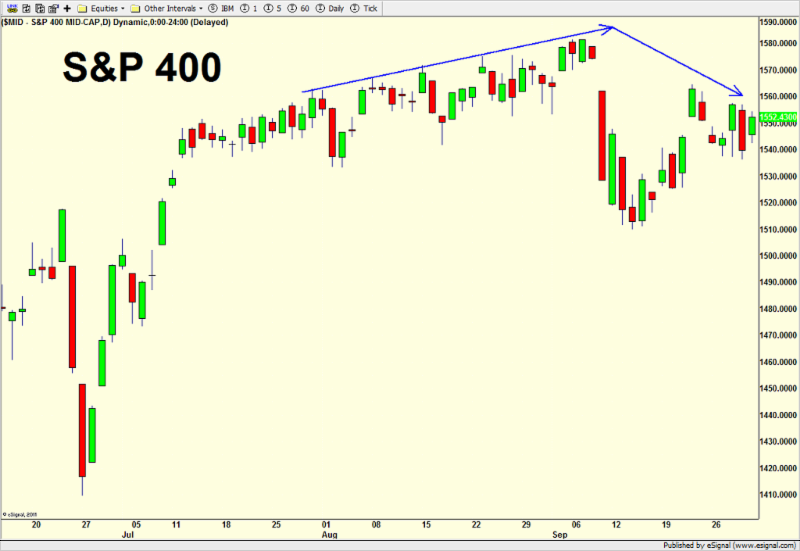
Below you can see the Russell 2000 which made a high with the S&P 400 in August and a slightly higher high last month, underscoring the market’s comfort level with risk in the small caps. The Russell usually peaks well before the Dow and S&P 500 as a new bear market begins.

Finally, the tech laden NASDAQ 100 is below and it just hit its most recent high last week. This is very supportive of the bulls over the long-term as this index is a leading bellwether

With the NASDAQ and small caps leading the major indices, the bull market is alive and well and not close to ending, regardless of what happens over the next day, week or month.
If you would like to be notified by email when a new post is made here, please sign up HERE.
