Canaries Still Singing
With many all time highs seen in October, it is a good time to review the canaries in the coal mine for signs of trouble. Remember, canaries are only valuable at major market peaks and bottoms. For the vast majority of the time in between, they will be of little value.
We review all of the major stock market indices and sectors along with other key indicators of overall market health. At major market turning points, we will often see glaring divergences or non confirmations with a few of the indices, sectors and indicators lagging the move. Let’s do a quick walk with the major indices and see if we have any warning signs.
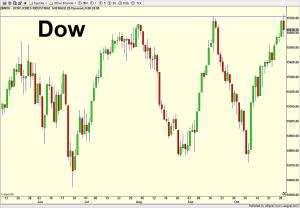
The Dow is first and it just recently scored an all time high, which washed away the very small yellow light in October.
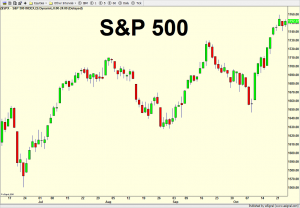
The S&P 500 is next and it, too, recently hit an all time high.
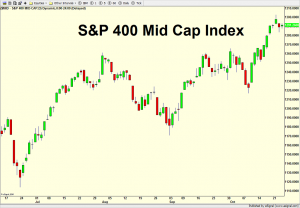
The S&P 400 Mid Cap is below and look how quickly it went from laggard (mid Sep to mid Oct) to leader now where all time highs were made.
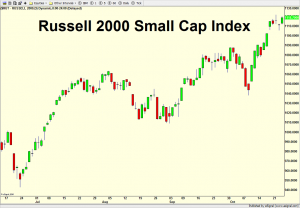
Ditto with the Russell 2000 Small Cap, which has been the single market leader since mid October and throughout 2013.
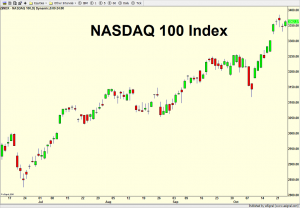
The NASDAQ 100 is next and this index has frustrated me somewhat this year, especially in the middle of the year. Although it still needs to rally roughly 50% to eclipse its Dotcom bubble all time high from 2000, the index is sitting in new 52 week high territory and that indicates strength.
Summarizing the indices, they are all in sync and show no sign that the bull market is ending.
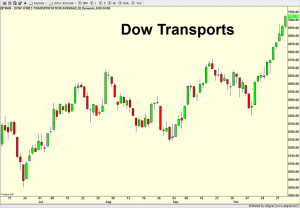
The Dow transports are below and they are vitally important to confirm highs and lows with the Dow industrials. In the current case, the transports are and have been a market leader all year and that continues today as all time highs made.
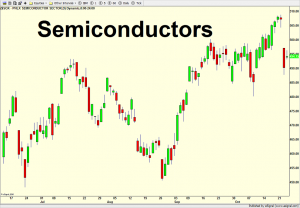
The semiconductors are next and they are so important because they reside at the beginning of the technology food chain. The only caveat with them is that they are very volatile and can give more false warning signs that the others. As with the NASDAQ 100, they are far away from all time highs, 175% to be more precise, but they are currently seeing 52 week highs and their best levels since 2001.
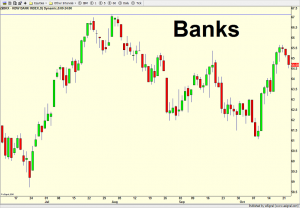
The banks are below and are nowhere near the high they hit in 2007. That’s okay, but more recently, they have not exceeded the high they saw in June of this year. I consider this a mild warning sign.
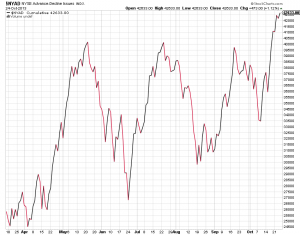
The New York Stock Exchange Advance/Decline line is next, which measures the cumulative number of stocks going up and down each day. Until very recently, warning signs were given that the rally was becoming more and more selective. As you can see, the A/D line blasted through the previous all time highs and there is no longer a warning here.
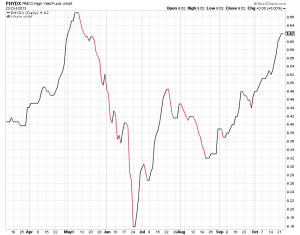
Finally, the high yield bond sector is below using the PIMCO High Yield Fund as its proxy. I felt strongly that the peak seen in May of this year was THE high and that this was the first nail in the coffin for the bull market. Junk bonds have certainly surprised to the upside since the Fed did not taper in September and the run has been very strong, causing me to waver on whether the May peak could be slightly exceeded. In any case, this remains a warning sign, but not nearly as much as before.
Over the past few months, the market has breathed life into a few of the canaries on life support and the bull market remains alive and well. Because we do not have a preponderance of warnings, it will likely take at least a decline followed by a narrow rally to before we start seeing canaries die.

