Early January Indicator Calls for More Upside While Oil & Gold Hit Peaks
With the much ballyhooed Santa Claus Rally out of the way which I really reduced to meaningless in the grand scheme of things, the media has turned its attention to the Early January Indicator (EJI). As Yale Hirsch of Stock Trader’s Almanac fame discovered, as goes the first five days of January, so goes the rest of the year. Since 1990 when the EJI is positive, stocks end the year higher 78% of the time versus 74% for any random year since 1990. That’s not exactly the layup it seems on the surface. If we look at more recent data since 2000, the percentages don’t change very much. As we have seen with a number a catchy seasonal stats and studies which look great on the surface, they often don’t give you the edge when compared to random.
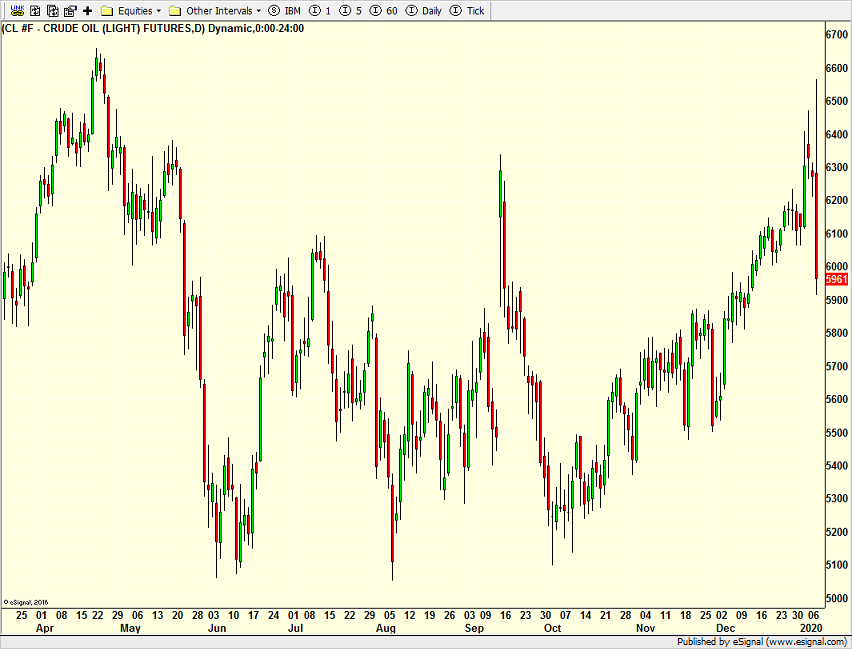
Turning to the Iranian situation and its impact on oil and gold, as I mentioned in media segments this week, when commodities rally into an event like we saw, we usually see some type of peak as missiles begin to fly. The opposite is true when they fall into an event. All week I spoke about watching for a peak in crude oil which had rallied hard since early October.
On Monday, Tuesday and Wednesday, crude closed lower than where it opened all three days. Wednesday’s emotional session was truly one for the records books. Early on crude oil scored a 9 month high and a 17 day low on the very same day. That’s some wildly volatile action that isn’t seen very often. I feel confident in saying that the peak is in for a while and the risk is to the downside. I also wouldn’t be surprised to see crude trade in a range bound by the high and slightly lower than the low to calm things down.
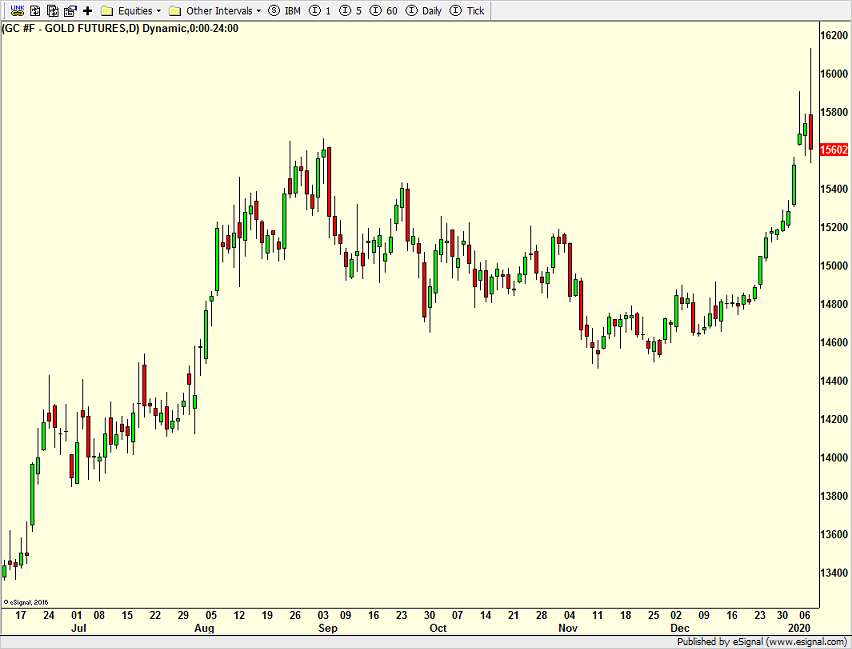
Gold, which was also on a tear of late, also saw some truly historic, emotional action on Wednesday, but not quite the range of crude. On the far right of the chart, just like crude, you can see what was a huge early rally to $1610 before the bears came to work and pushed gold all the way down to $1560. I think gold also looks to have put in a top for a while.
One more thing to add. Both crude and gold have seen historic levels of positive sentiment over the past few months to the point of real and tangible greed, much like we are seeing in stocks right now. While stocks haven’t seen their peak yet, I do think the giddiness of traders in gold and crude coupled with the emotional downside reversals have put a temporary ceiling on the two to let things settle down and hopefully wring out some of the weak handed holders and Johnny Come Latelies before the next meaningful rally can begin which I do see happening in the first half of 2020.
I will have more on the historic sentiment readings in stocks shortly, but remember that extreme sentiment readings alone won’t cause a change in trend. There is always a catalyst. As you know, I have been arguably the most bullish person out there for many years, first calling for Dow 30,000 when the Dow was barely at 20,000. Now, it seems like every pundit is revising history to get on board the freight train. While this is not 2000 again, it does have the look of early 2018 and mid 2011.
