Facts About The Bottom and the Breadth Thrust
The stock market bottomed on October 27th. Fact. We didn’t have a spike in the Volatility Index. Fact. Markets rarely bottom on Fridays and rarely when they close near their lows for the day. Facts. It ain’t easy.
Since the bottom we saw a very powerful rally with the right indices and sectors leading. The upside was so strong that a number of thrusts hit the market, rendering it with escape velocity, like a rocket that clears the earth’s gravity.
Fintwit was all abuzz about these thrusts but especially the one I am sharing below developed by the late and great investor, Marty Zweig of Wall Street Week and Wall Street fame. Marty was a legend who was a market assassin without emotion. My dad knew him and always had great things to say.
Marty developed the Zweig Breadth Thrust (ZBT) to identify time where the stock market went from super weak to super strong in a matter of days. I will spare you the wonkiness of the formula. And different data vendors may have different data and ZBTs.
Below are the thrusts that are not debatable. I give you the date and returns for the S&P 500 over the ensuing 3, 6 and 12 months in the modern investing era.
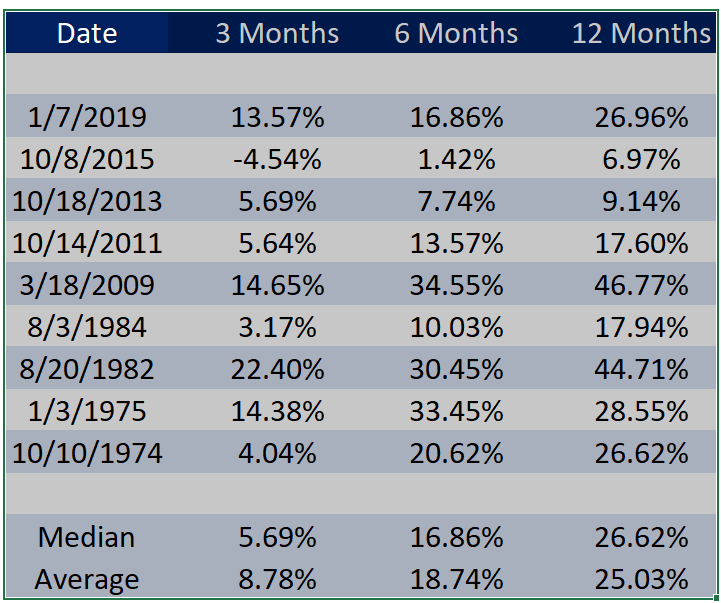
Notice anything about the returns since 1974? There is only a single negative return after the ZBT. Look at the median and averages over 3, 6 and 12 months. Those are super powerful. The devil’s advocate position would be that there aren’t enough instances and too many bull moves are missing. And that would be correct. Additionally, one could argue that with decimalization, it has become much easier to generate thrusts which is true. But still, the results are the results and they cannot be ignored.
On Monday we bought IJS and levered, inverse NDX. On Tuesday we bought more IJS and more SPYD.
