Is Big Tech Cooked? Nifty Fifty May Guide Fab Five
It’s certainly no secret that I have been negative on big tech and concerned that the epic run relative to the rest of the stock market exceeded even the Dotcom Bubble levels. This has been the case for the past month. The only thing that has changed lately is that the broader stock market, which peaked on June 8th, has stepped up to lead. That was one of the outcomes I have mentioned. Dow Industrials, S&P 400, Russell 2000, banks, transports, industrials, materials and energy have all stepped up to broaden out the rally. That should be healthy.
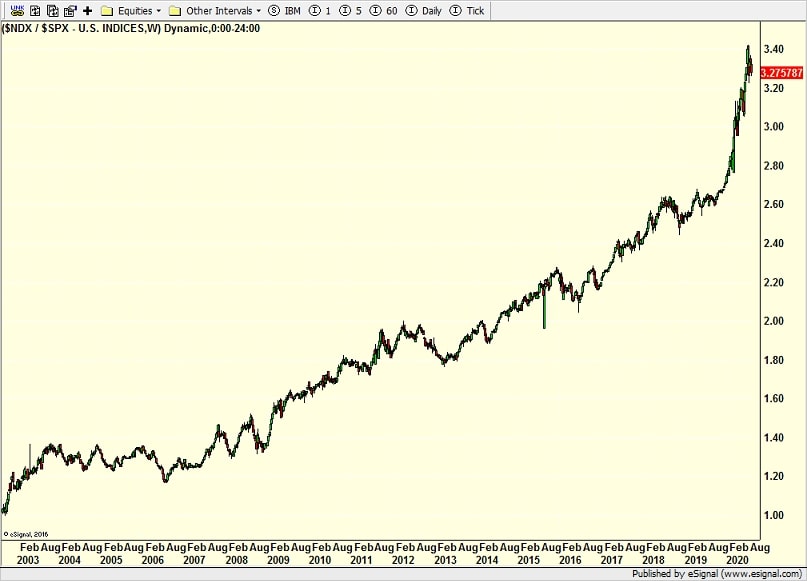
Did big technology peak for good? I highly doubt it. Did it peak relative to the broad market? It’s certainly possible. Here is a long-term chart of the relationship between the S&P 500 and the NASDAQ 100. It’s crazy. However, it was crazy in 2019, 2017, 2015 and so forth. It has just become even more nuts. And I guess it could go even higher, but the risk/reward would be that much more uncomfortable.
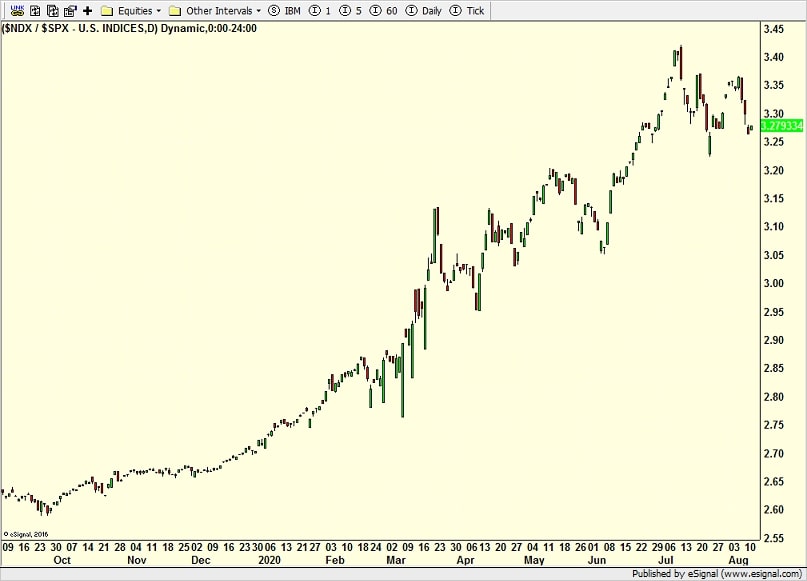
Taking a slightly more micro view, here is the same chart over the past 10 months. The relative outperformance is just incredible. For the strategies we have that own the NASDAQ 100, the run has been fun top say the least.
Before people start emailing me about just how amazing the fundamentals are in the Fab Five, Apple, Facebook, Google, Amazon and Netflix, save your keystrokes. I won’t argue. In fact, their fundamental cases are perfect, flawless in fact. But so what? For those old enough to remember the Nifty Fifty in the early 1970s, this is almost a mirror image. That didn’t end so well and this won’t either. I have no idea what will tip the market to revalue earnings, but it’s always something.
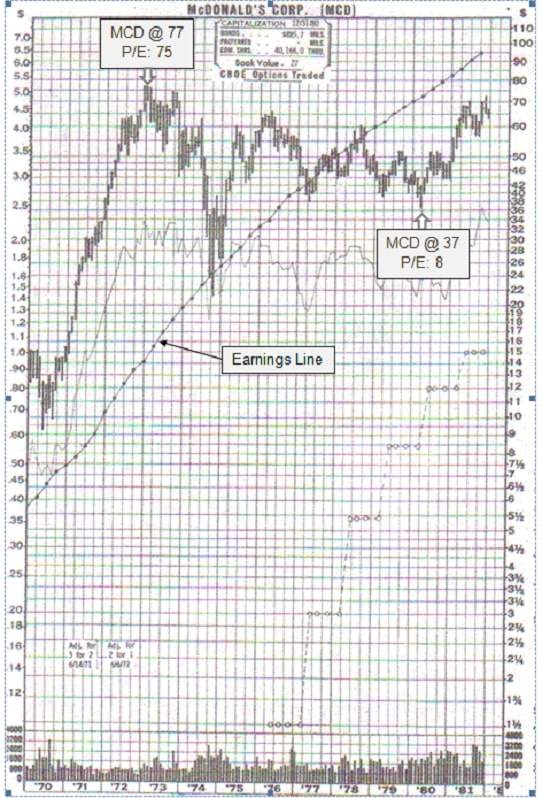
My Twitter friend, Walter Deemer, posted a great chart of McDonald’s from that era. Going into the 1973 bull market peak, these Nifty Fifty stocks could do no wrong. They were the new paradigm; going to change the world. (Seems I have heard that claim before.) And some of them actually did!
Look below at the all-time high in the stock and the earnings line below. The stock peaked in early 1973 but earnings just kept powering higher as the market revalued what it was willing to pay for earnings. MCD’s price/earnings ratio (PE) went from 75 in early 1973 to 37 in 1980 right before the stock was about to begin its next bull market.
I believe the same thing will happen this time around with the Fab Five, but I haven’t a clue what the catalyst will be. And yes, our individual stock accounts do own some of the Fab Five. When I have concerns, I will typically trim the position size back down to what it was at purchase. For example, if I bought a 5% position in Amazon and the stock grew so much that it became a 10% position in the portfolio, I may sell half to get it back to its original sizing.
Finally, stocks saw another one of those wicked intra-day reversals on Tuesday. These seem to have become more frequent since the bull market began in March. While they look downright ugly on a chart, forward performance doesn’t match the warning they give although you can certainly cherry pick a few at major highs. I find these days are good for pruning and making sure you really like what you own. If we see follow through selling on Wednesday and stocks close lower, that would cause me to rethink about a deeper pullback beginning.
