“KEY” Reversal and the 50 Day Moving Average Boogeyman
On Friday, the major stock market indices saw yet another “dramatic” reversal as strong early gains were not only given back but also turned into losses during the afternoon before closing off the lows. People who look at charts usually forecast further weakness ahead with some even using the one day pattern to call for the end of the bull market. I think you have to take these kinds of days in context. One day doesn’t end a bull market or cause a selling stampede. And if/when the reversal day is closed above, it becomes moot anyway.
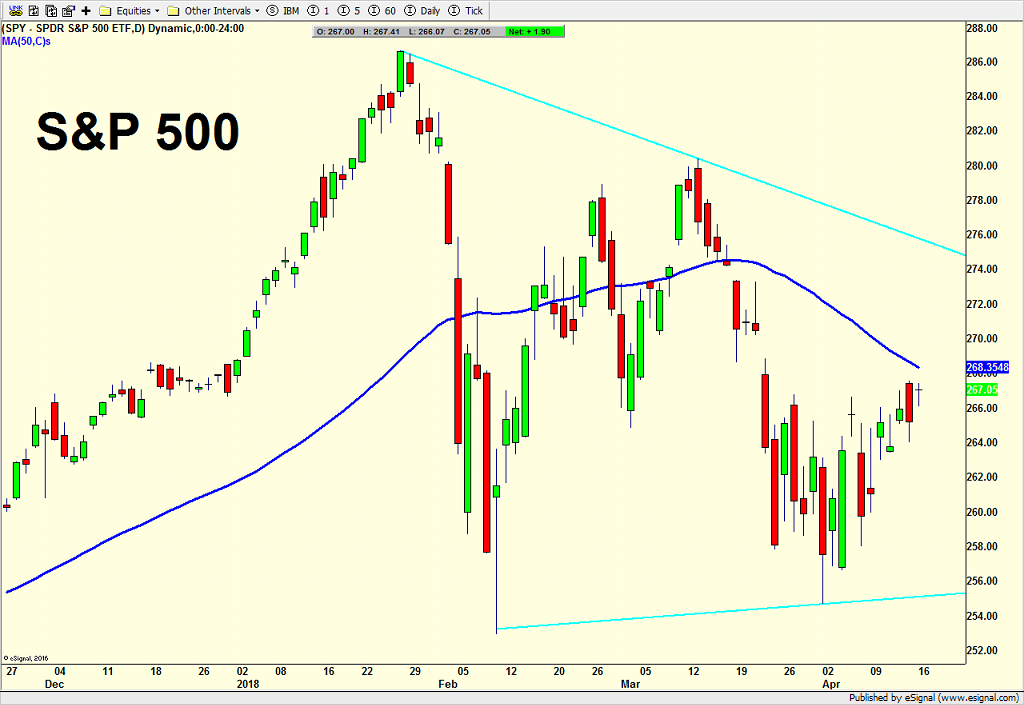
Besides the reversal day which you can see on the right side of the S&P 500 chart above, you can also see the light blue lines which have defined the range stocks have been in since late January. In other words volatility has gone from extreme to more moderate as the lines continue tighten and will eventually converge over the summer.
Additionally, there seems to be a fascination now with the dark blue line which is the average price of the last 50 days, also known as the 50 day moving average. Pundits are saying that stocks are struggling to regain this line, especially since the line is descending. IF all of the major indices were in the same position, the conclusion may have merit. However, with the S&P 400 and Russell 2000 above their own 50 day averages, I dismiss the conclusion as nonsense. In fact, I wouldn’t be at all surprised if all five major indices closed above their 50 day averages and then we saw another pullback in stocks to trap those people.
