Looking Under the Hood of a Midday Waterfall Decline
This is going to be a little different kind of article that focuses on the minute to minute moves in the stock market. People often ask what happened or why something happened in the middle of the day which seemed rather large and out of the blue. Last week’s 800 point down Tuesday had two very obvious things occur so I am going to share. Below is a chart that I found very interesting. Each little red or green bar represents 5 minutes in the trading day for Monday and Tuesday. Monday’s sharply higher open was due to a few relatively benign words from Presidents Trump and Xi regarding their tariff tantrum. Frankly, I was a little surprised at just how high stocks were set to open as I wrote about on www.investfortomorrowblog.com as well as on Twitter. I thought for the most nimble of traders, smart money would be selling into that news. In hindsight I certainly wished I was that smart money doing the selling after what has transpired since Monday’s open. As stocks traded towards the unchanged level on Monday, the S&P 500, which is the one index computerized traders use most, breached the average price of the last 200 days, also known as the 200 day moving average. I have long written about this widely followed gauge of the long-term trend for stocks. While we do not use it in our work, so many other people do that it warrants paying attention to its level.
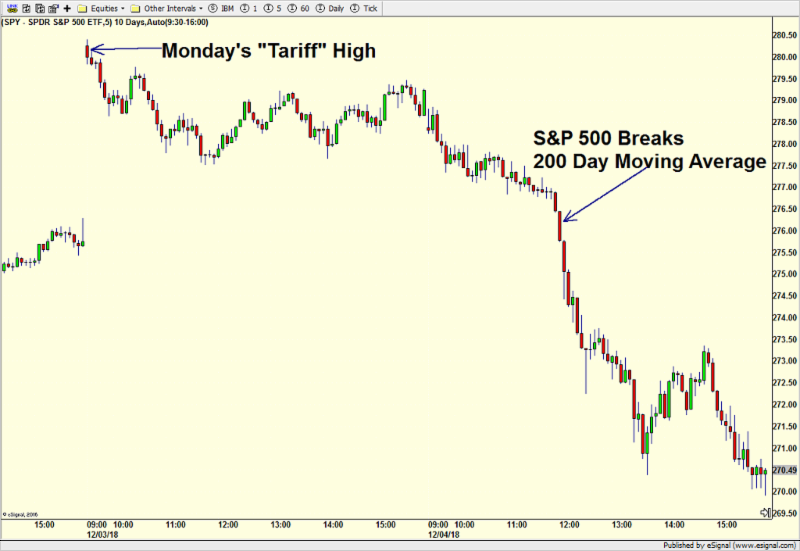
Above, you can see the arrow where where the S&P 500 breached the 200 day moving average. What happened next was fascinating if you are in to that sort of thing. You can see that the S&P 500 began to accelerate lower without any attempts to rally. In trading terms, that was very heavy, like trying to breathe with elephant sitting on your chest. To gauge the intensity of that breach of the 200 day moving average, we turn to the chart below which is almost all noise. On the left side you can see Monday’s high point right at the open. Without getting too technical and boring you even more, the levels that matter on the chart are those above 1000 or below -1000. That’s where you can see intense buying (+1000) or selling (-1000). On Monday, the bulls got sucked in for a few minutes before having the rug pulled from beneath them. Now look at the bottom of the chart for Tuesday where I show lots of little arrows. There, as the S&P 500 was breaking below the widely watched level of 2760, institutional investors using sophisticated computer programs hit the sell button to get out at any price. They didn’t care where as long as it was right away. The selling was intense and broad-based. We do not know exactly why.

The first few programs around noon were accompanied by massive buying in the bond market, so we can reasonably conclude that at least one big player was selling stocks to buy bonds. Beyond that, there isn’t a lot to offer.
I share this with you not because there is anything to glean from it regarding our strategies or your money, but rather just to give you a glimpse into what can happen during big market days.
