More Panic in the Air. Looking for Back to Back Rally Days.
I was hoping to post a number of indicators showing historic levels of bearishness and oversold readings in the stock market. However, when I started creating the charts, I couldn’t stop and I just gave up after making 18. Perhaps, I will offer again in a future post. As has been the case with every post, these are truly history making times, in the financial markets, the economy, global health, etc. The word “generational” doesn’t seem to do it justice.
Today (Wednesday) was the 6th day of panic in the past 14 trading days and yet another potential low for stocks. During “normal” times, just one day of panic is enough for stocks to hammer out a low of some sort. The average daily move over the past three weeks exceeds 5%. That’s daily, not monthly or even weekly. Now that’s volatility.
You may have noticed that once stocks began to plummet, some pundits stopped offering short-term forecasts. I know I did because doing this for more than 31 years, I have learned that once the markets stop functioning normally and panic sets in, traditional or sensible analysis just stops working too, for the time being. Some folks keep on calling for levels like popular moving averages which have all been exceeded. Some have used trendlines connecting old lows in a rising fashion. Many were looking at some “key” prior lows to be tested or revisited.
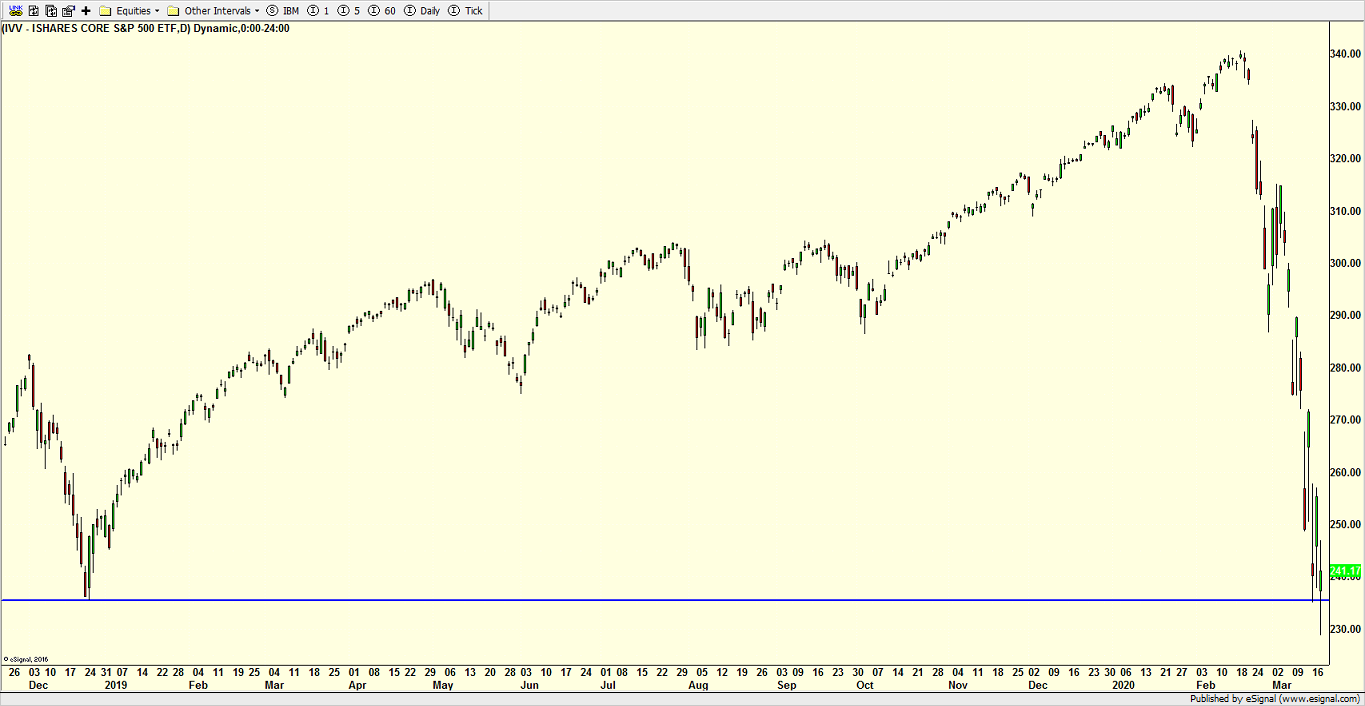
Today, the S&P 500 briefly breached its lowest point from the Q4 2018 massacre as you can see below at the horizontal blue line. By the end of the day, it had regained that level and closed above it. Again, during “normal” times, that would be one way for stocks to hammer out a low of some sort. However, when I look at the other major stock market indices, the Dow Industrials, S&P 400 and Russell 2000 are all well below those levels. The NASDAQ 100, however, remains well above its Q4 2018 low. It would have been much more convincing if most of the indices lined up together rather than have one index on an island.
Thursday is another day as they all have been. With so much price movement taking place overnight, it has become expected to see a 5% move just at the opening of trading and that’s what I expect on Thursday. It is quadruple witching this week which is a fancy term for the big expiration of options and futures four times a year. In “normal” times, a big decline during the week would tend to begin its reversal late Wednesday afternoon with a rally ensuing on Thursday. Although these are anything but normal times, the bulls will take the slightest edge out there to begin the bottoming process.
I want to close with something more tangible and actionable. Since the stock market peaked on February 19, there has not been any back to back rally days. None. Seeing two consecutive up days will be one sign to look for that perhaps the tide is turning.
