Pink & Blue Are Not Just for Baby Stuff
In yesterday’s post I mentioned that during most stock market declines, it seems like everyone turns to charts and technical indicators as their economic and fundamental indicators fail. They quote their own “key” numbers and speaking from 30 years of experience, if it’s obvious, it’s obviously wrong. In other words, when so many pundits turn to the same charts, the market does its best to punish the most people. I want to spend a few minutes explaining the most basic and easiest to understand technical indicators which is what you generally hear in the public domain because most pundits aren’t advanced enough to take it any further.
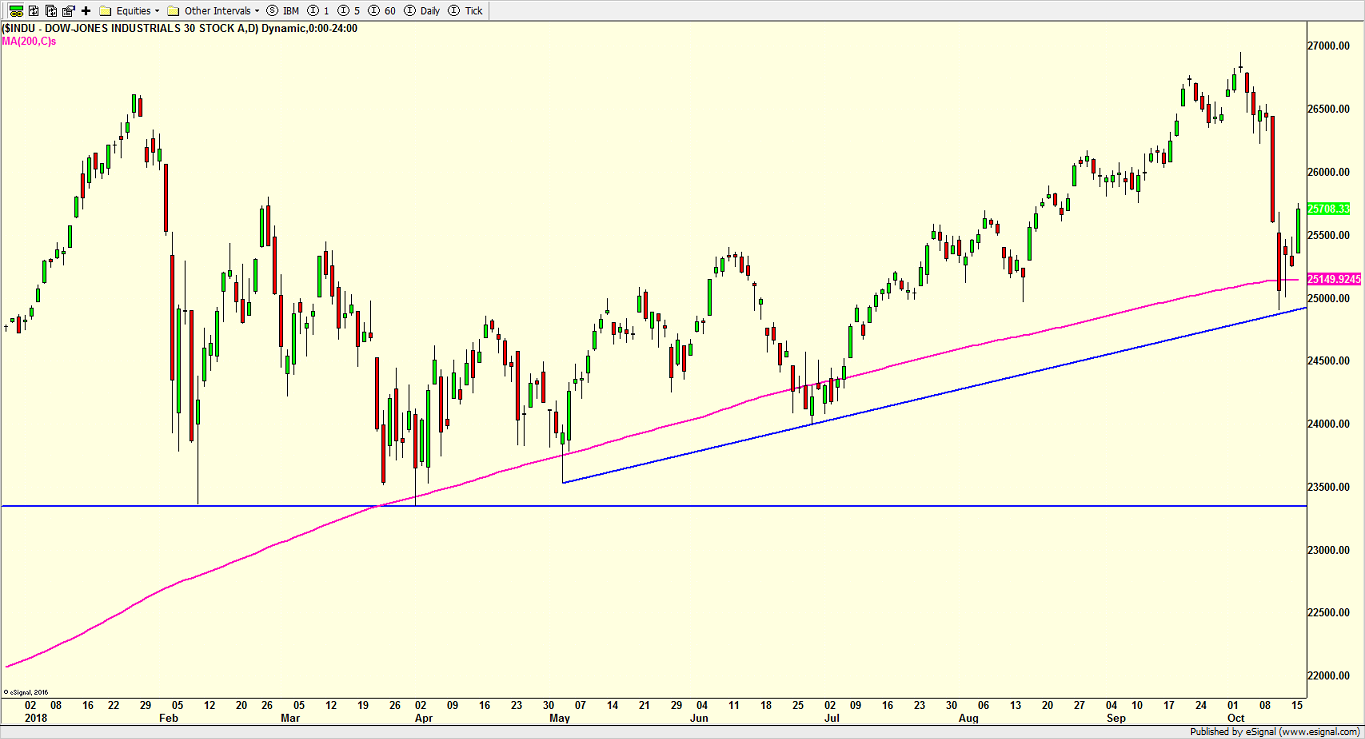
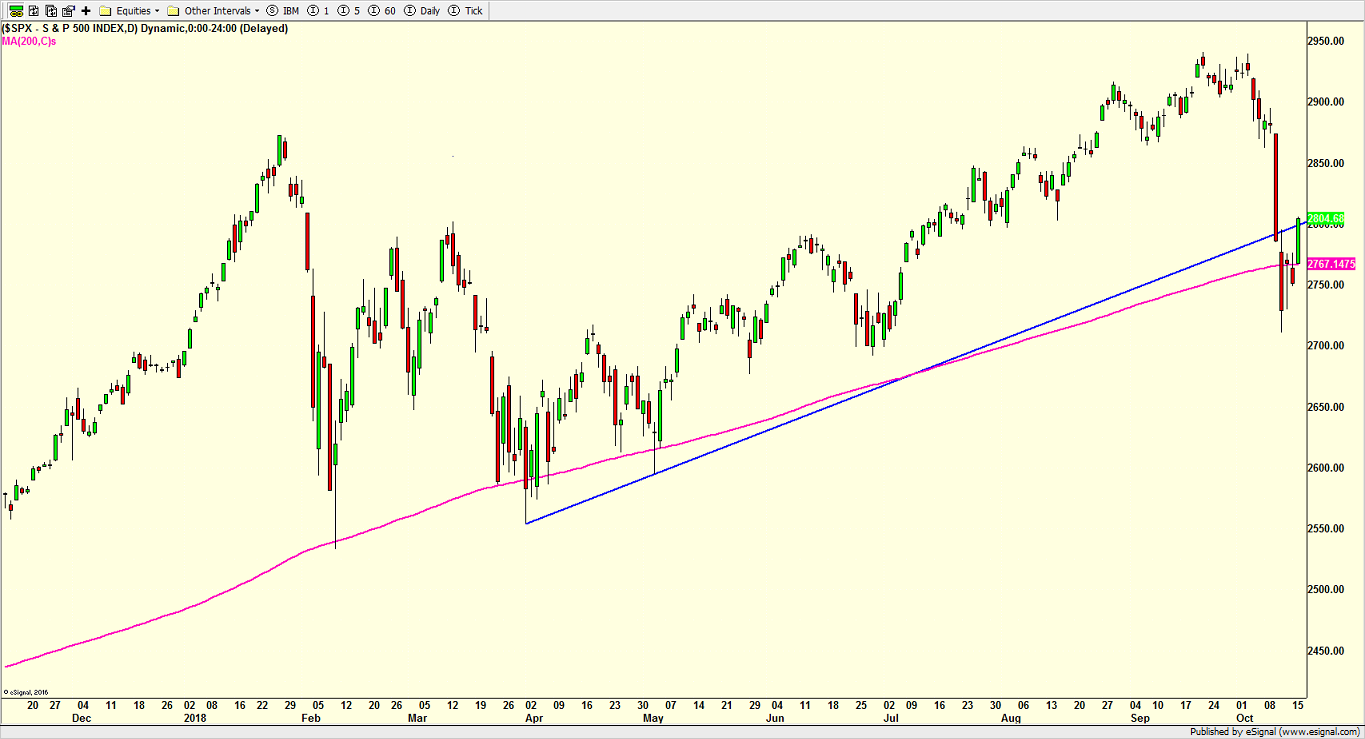
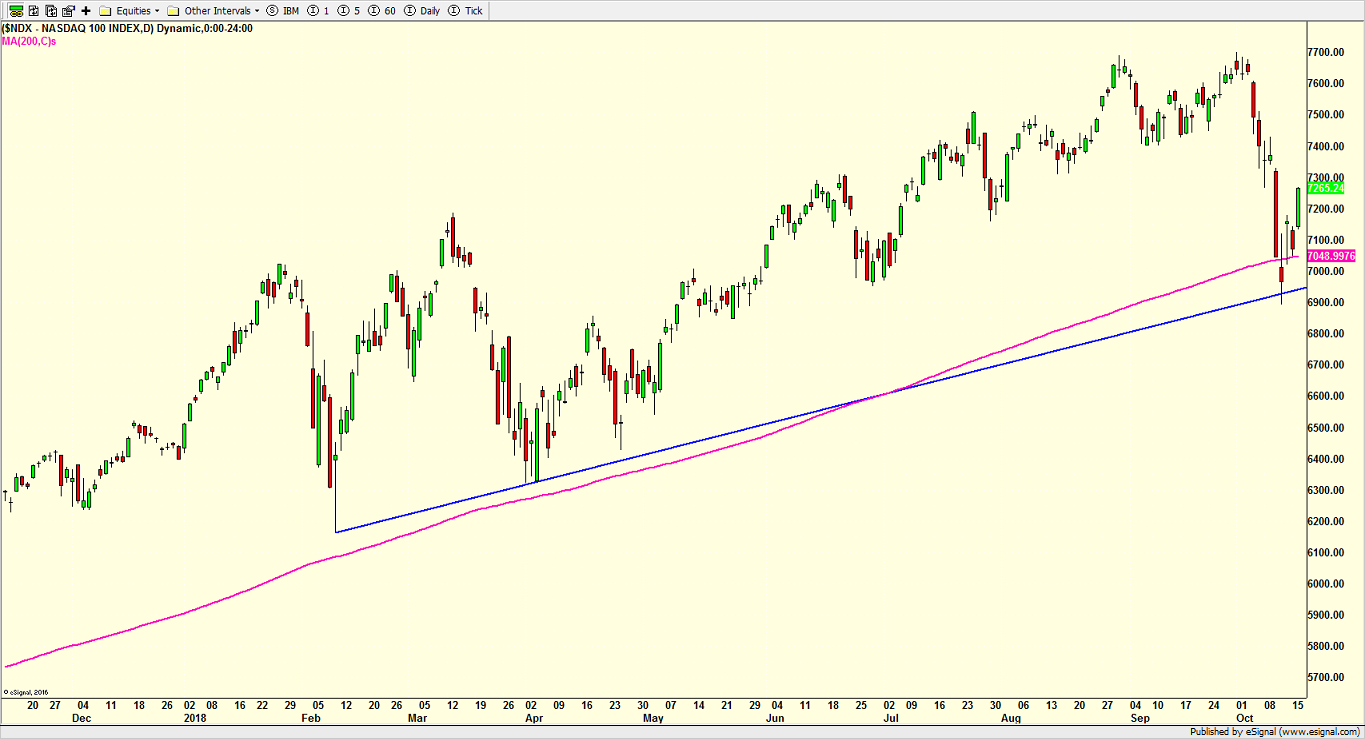
The three charts below are of the Dow Industrials, S&P 500 and NASDAQ 100 in that order. The pink lines represent the average price of the last 200 days, also known as the 200 day moving average. It’s “moving” because every day as one piece of data is added, one piece of data from 200 days ago falls off. Many people simply use the pink line as a gauge of whether stocks are in an uptrend or downtrend. When price is above the pink line, it’s said to be positive and in an uptrend while the opposite is true when price is below the pink line.
You will also notice three upward sloping blue lines which do nothing more than connect the lowest prices from earlier in the year. That’s also known as a trend line. The more times price touches a trend line, the more important that line becomes. Two times is obviously the bare minimum and not exactly all that important.
During the decline, I heard some pundits opine that computer driven algorithms or trading programs were the cause of the drop. They were said to be gunning for the pink line so others who buy and sell based on the pink would be forced to take action. I find that mostly nonsensical.
What you can see from the three charts below is that all three indices declined to briefly breach their average price of the last 200 days along with saying hello to those trend lines. What’s more important is that at least for now, the bulls put up a stand at the levels they are “supposed” to, namely those pink and blue lines.