Sell Rosh Hashanah Buy Yom Kippur – Bears in Charge
There has been a trend in place for many, many decades that says to sell heading into the Jewish High Holy Days and buy coming out of them. Friday was the day to sell and next Monday’s close is the day buy. The theory says that Jewish investors would sell their material possessions during the most sacred period of their year to reflect on the year that was and atone for their sins as the period ends on Yom Kippur.
The trend worked a lot better decades ago than it has in recent decades. It’s yet another nice little saying that doesn’t play out when analyzed with real data.
Also on the seasonal front, this week is the single weakest week of the year. And there is a little fuel on that fire with options expiration being this past Friday. But let’s remember that seasonal patterns are best used as headwinds and tailwinds than rationale to alter a portfolio.
I have been notably and unusually cautious of late. I have warned that the first sign of a stock market low will come when lows from 9-11 are closed beneath. The stock market is there, but that doesn’t automatically mean a bottom will form today. It was just a necessary ingredient.
Next, I want to see the NASDAQ 100 and the Fab Five Plus stocks begin to outperform again. Recall that I first became concerned when these stocks were running away to the upside and “everyone” owned them. I wrote several pieces about using Apple’s split as a selling opportunity. All I got was hate comments and the usual “but, but, but”. Before the decline is over Apple will be down at least 25%. That’s real money. Ideally, I would absolutely love to see it under $100 as a spot to buy it, but we will see how things play out.
Remember how many times I wrote about the 2009 analog? 2020 was tracking perfectly. However, I always warn that all analogs eventually break down and the 2009 one is basically dead.
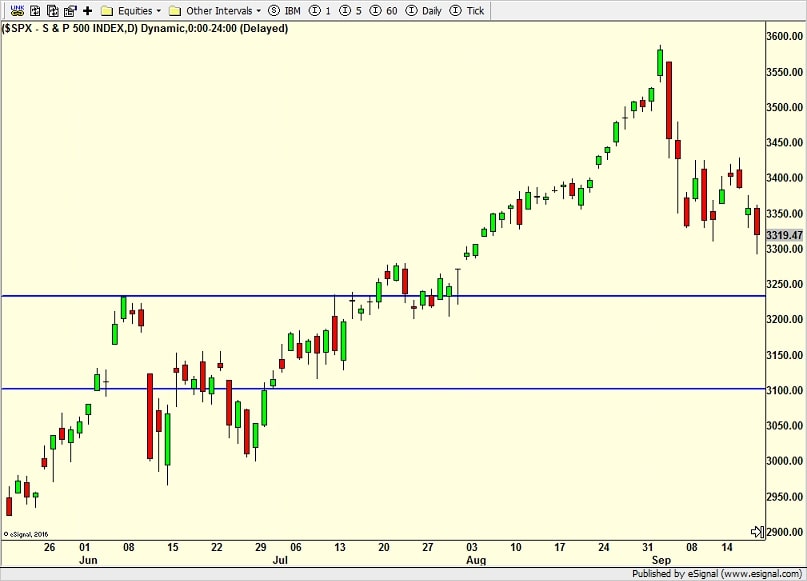
Several folks have asked if I had any price levels to watch for the bottom. Look at the chart below. I added those two blue, horizontal lines to show the general range I am looking at right now on the S&P 500. I know; that’s a wide range, but until I see more data that’s all I have.