Date: November 1, 2017
***Special Fed Day Alert. No Rate Hike. No Surprises***
Behavior Models for the Day
As with every Federal Open Market Committee (FOMC) statement day, there is a model for the stock market to follow pre and post announcement. Certain environments have very strong tendencies while others do not. Eight meetings ago was one of the rare times where the models strongly called for a rally on statement day which was correct as well as a decline a few days later which was also correct.
Today, as with most statement days, the first model calls for stocks to return plus or minus 0.50% until 2:00 PM. There is a 90% chance that occurs. If the stock market opens outside of that range, there is a strong trend to see stocks move in the opposite direction until 2:00 PM. For example, if the Dow opens down 1%, the model says to buy at the open and hold until at least 2:00 PM.
The next model calls for stocks to close higher today and rally after 2:00 PM. That is usually a very strong trend, 80%+, however with the Dow sitting at all-time highs with barely a hiccup in two months, the bulls exhausted a lot of energy, similar to what we saw at the last Fed meeting 6 weeks ago. That trend’s power has been muted significantly to less than 50%. That’s not exactly the kind of trend worth trading.
Finally, there may be a trend setting up for a post statement day decline, but there are a number of rally factors that still need to line up.
No Rate Hike & No Balance Sheet Taper Update
The good news is that short-term interest rates will not be moving higher at 2:00 PM. That will likely happen at the December meeting as the economic evidence certainly supports another 1/4% hike with GDP at 3%, unemployment at new lows and consumer confidence at new highs. I also don’t expect any news on the Fed’s plan to taper the size of its balance sheet.
Six weeks ago, I offered that the Fed would announce the cessation of reinvestment of certain instruments, if not all, to the tune of $300 to $500 billion a year. It turned out that my forecast was too aggressive as Yellen’s plan began last month with a paltry $4 billion in runoff and scales up to only $20 billion per month later in 2018.
Velocity of Money Still Collapsing
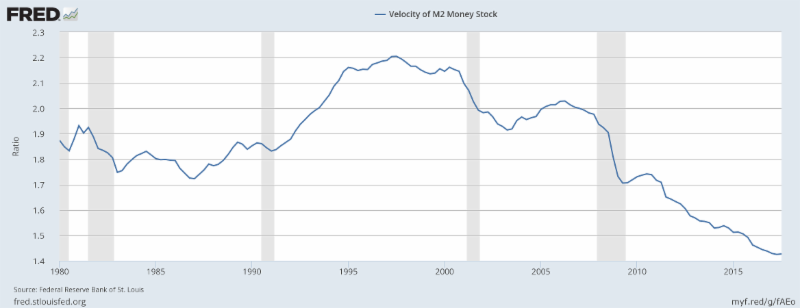
Below is a chart I have shown at least quarterly since 2008. With the exception of a brief period from mid 2009 to mid 2010, the velocity of money was, is and will continue collapsing. In the easiest terms, M2V measures how many times one unit of currency is turned over a period of time in the economy. As you can see, it’s been in a disastrous bear market since 1998 which just so happens to be the year where the Internet starting becoming a real force in the economy. Although it did uptick during the housing boom as rates went up, it turned out to be just a bounce before the collapse continued right to the present.

This single chart definitely speaks to some structural problems in the financial system. Money is not getting turned over and desperately needs to. The economy has been suffering for many years and will not fully recover and function normally until money velocity rallies.
It would be interesting to see the impact if the Fed stopped paying banks for keeping reserves with the Fed. That could presumably force money out from the Fed and into loans or other performing assets. It continues to boggle my mind why no one calls the Fed out on this and certainly not Yellen at her quarterly press conference.
If you would like to be notified by email when a new post is made here, please sign up HERE

