Stocks Continue to Dance Just Like 2008
On January 21st, I put out this piece calling for the internal or momentum low. That was the bottom where stocks stopped going down in accelerated fashion and the majority of the damage was done. Typically, that’s not the low where the strong rally begins. That’s later. In this case, from a low in March and then into Q2.
http://www.investfortomorrow.com/newsletter/CurrentStreet$marts20160121.pdf
I know I have beaten the proverbial dead horse when I say that 2016 looks nothing like 2008 from an economic or fundamental point of view. I don’t see any reasonable chance that the markets in general behave anywhere close to the way they in 2008.
http://investfortomorrowblog.com/archives/2085
The only valid similarity has been a price analog that I began discussing in early January. Price analogs have been used for decades, across countries, asset classes, etc. Eventually, every single one of them breaks apart.
With that in mind, let’s update the price chart for the S&P 500 from 2008 and 2016 through today.
In 2008, as I have mentioned before, stocks declined right out of the gate, but really just continued a correction that began in late 2007 as you can see below. Prices really accelerated lower into MLK weekend and bottomed when the markets reopened on Tuesday. From the low, there was an 8 day rally to relieve the very oversold nature of the market.

2016 has also seen selling right from the start, but really just continuing the correction that began in late 2015. Selling was strong into the MLK weekend and stocks bottomed on the Tuesday after. Just like with 2008, the initial rally lasted 8 days.
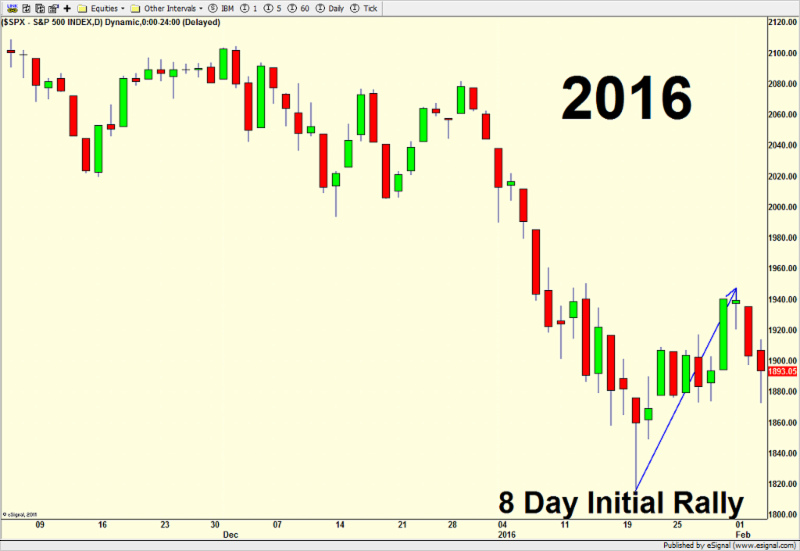
IF the price analog continues, stocks should see a secondary low later this week and embark on another rally towards Monday’s peak. Remember, again, that eventually ALL analogs diverge and knowing when is the key!

In summary, while this comparison looks really nice on a chart, it’s also something I have written about before from other analysis I have done. I keep referring to March as the time when the stock market should begin the real rally, where the January bottom was when the majority of the damage would end and stocks would stop going down. It’s also a presidential election year and Q1 bottoms are also typically seen in March.
If you would like to be notified by email when a new post is made here, please sign up HERE.
