The Plunge is Here – Next Opportunity for Bottom is Before Wednesday & The Fed
Before I dive in, here are the last two media segments I did over the last week or so with very specific comments on the markets over the short and intermediate-term.
Investors are overloaded with mega cap tech stocks
Fearless Forecast 2022 – UPDATED
Three straight days of heavy selling for the stock market with Friday looking the ugliest. Wherever this decline finds a low, the fact that the selling is accelerating means that at least a trading low should come sooner than later. However, until the downside momentum is broken, there is no easy way to take a stab at the level of the bottom.
When I went to bed after watching the single best weekend of pro football ever, the overnight futures were up almost 1%, which made me think, UGH. After accelerating market plunges, the last thing I like to see if strong overnight action that lasts into the morning. When I woke up, those gains had disappeared and markets look like they will accelerate losses into the open. That is better behavior if you want to see a market bottom. At some point, those who are left to sell in the short-term, just throw in the towel and capitulate. That looks to be in the process of happening right now.
For the week, we have the Fed’s first meeting of 2022 and that event can certainly be the catalyst for a market bottom. We hear from Jay Powell & Company on Wednesday at 2pm. If a low is coming this week, I would expect it to be in before we get to Wednesday, meaning on Monday or Tuesday. A client who trades some of his own money on a very short-term basis is good about asking how to manage risk when markets plummet. When markets trade like this, I think it’s a good practice for very short-term traders to not go home with losses. In other words, whatever is bought during the day is not held over at a loss.
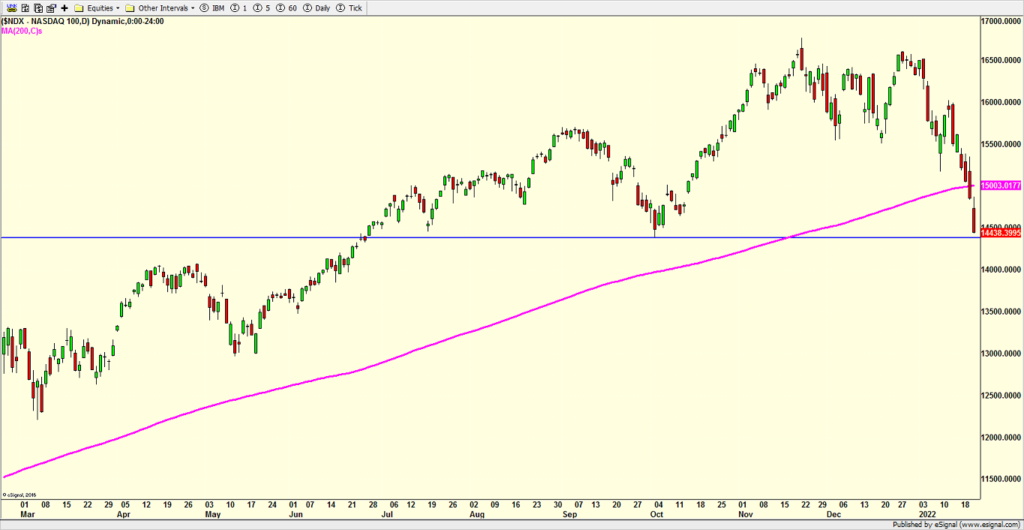
Let’s take a look at the NASDAQ 100 which is full of technology and overweighted with Apple, Google, Facebook, Microsoft, etc. The bulls have been watching the pink which represents the average price of the last 200 days. As you can see, the index knifed right through that line as if it didn’t exist. This is the kind of behavior often seen during the meat of a selling wave. The horizontal, blue line is the price level seen at the lowest point of Q4 which should be breached before any low of significance is attempted.

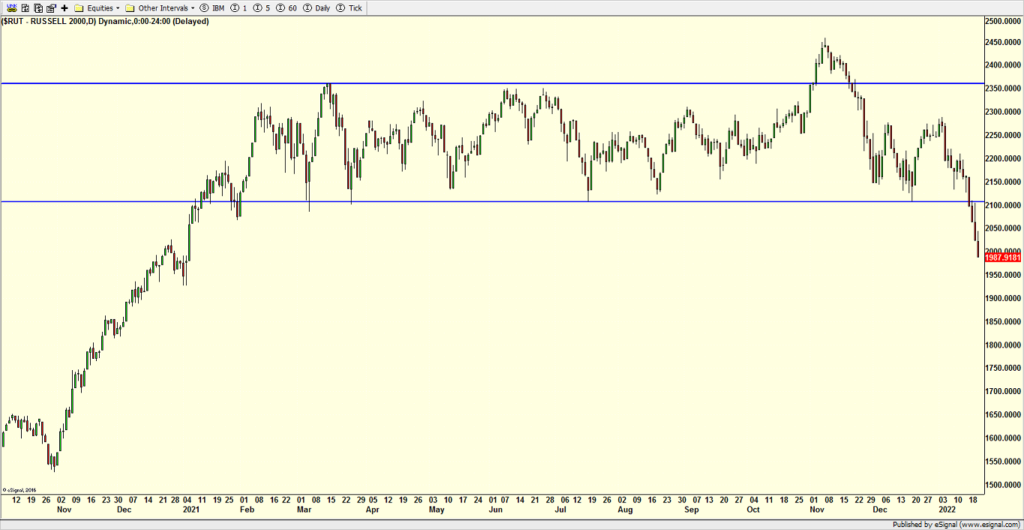
Below is a chart of the Russell 2000 Index of small cap companies. For most of 2021, it spent time going sideways, digesting the huge rally to end 2020. In late 2021, the index briefly broke out higher and sucked in major money, including some of mine. That move failed almost immediately and the index has been down ever since, including cutting right through the lowest levels it had seen throughout 2021. This represents a longer-term issue that will likely be a theme for 2022.


