Trump Tariff Tantrum & 200 Day Moving Average
We woke up today with more of the Trump Tariff Tantrum. This time, China responded as everyone thought they would, but the markets reacted much worse with the Dow looking to be down 600 points at the open. I am much, much more concerned about where stocks close today rather than where they open. To wrap up this decline, I would either want to see a 1000 point down day or afternoon strength today. As I continue to write, tariffs and trade wars are just plain bad. I don’t care what the President tweets, no one wins. And then they spread. And prices go up. And job creation collapses. And recession ensues.
However, all we have so far is jawboning. The actual tariff process takes months before it is enacted. There will likely be negotiation. For our economy’s sake, let’s hope that the adults come to the table in good faith from all sides. If they fail, those tariffs will be one strong nail in the coffin of the economy and markets.
Turning to the markets, while I am still on the lookout for that elusive 1000+ point down day that takes the Dow under 23,000 to wrap up the decline, it may or may not occur. On Monday, all the talk was about the various stock market indices testing or visiting their long-term measure of trend, the 200 day moving average which is a just a fancy name for the average price of the last 200 days. Normally, I wouldn’t give this much thought, but when non-technical people and the media talk about market technicals and moving averages, it’s worth paying attention.
There is absolutely nothing magical about it or the number 200. It is very widely followed and people do make buy and sell decisions based on whether price is above or below it. Most people view the 200 day average as just a sign of trend. If prices are above it, the trend is said to be up. If prices are below it, the trend is down. In the computer based trading world, algorithms are set to flood the market with trades based on the price trading around this supposed “key” number. And these computer programs can actually force the hand of those investors who buy or sell based on this average.
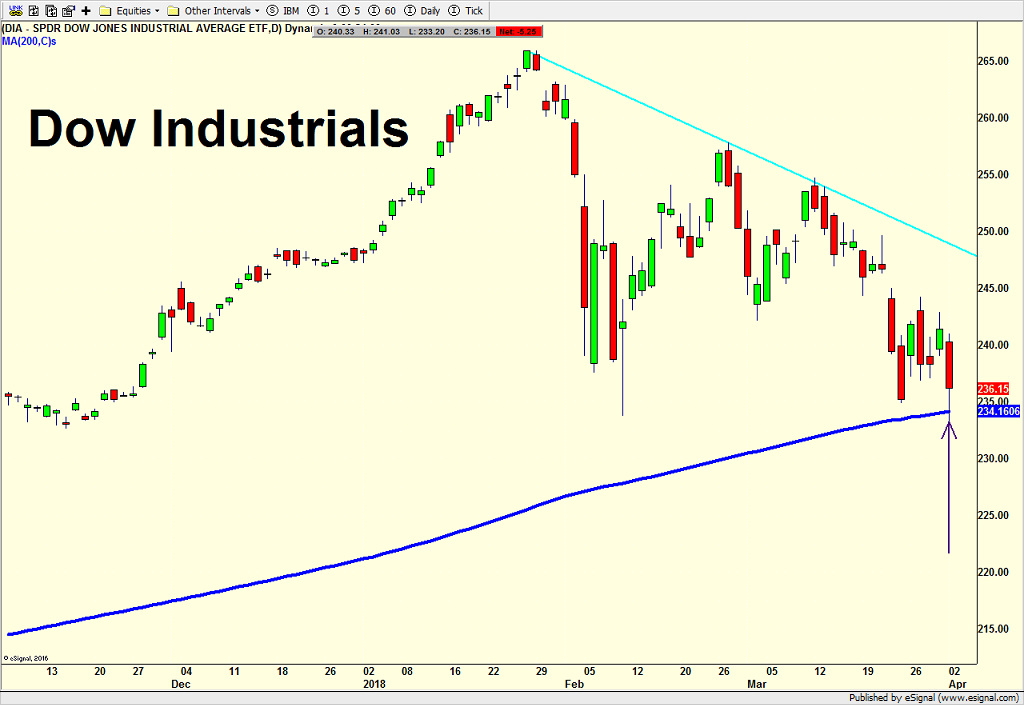
Anyway, I thought it would educational to run through the various indices and point out where they have touched their 200 day moving averages or long-term trends of late. The Dow Industrials are first and you can see the purple arrow from Monday. If and when the Dow closes a day below Monday’s lowest price level, there will likely be some quick and sharp selling with the computers taking over.
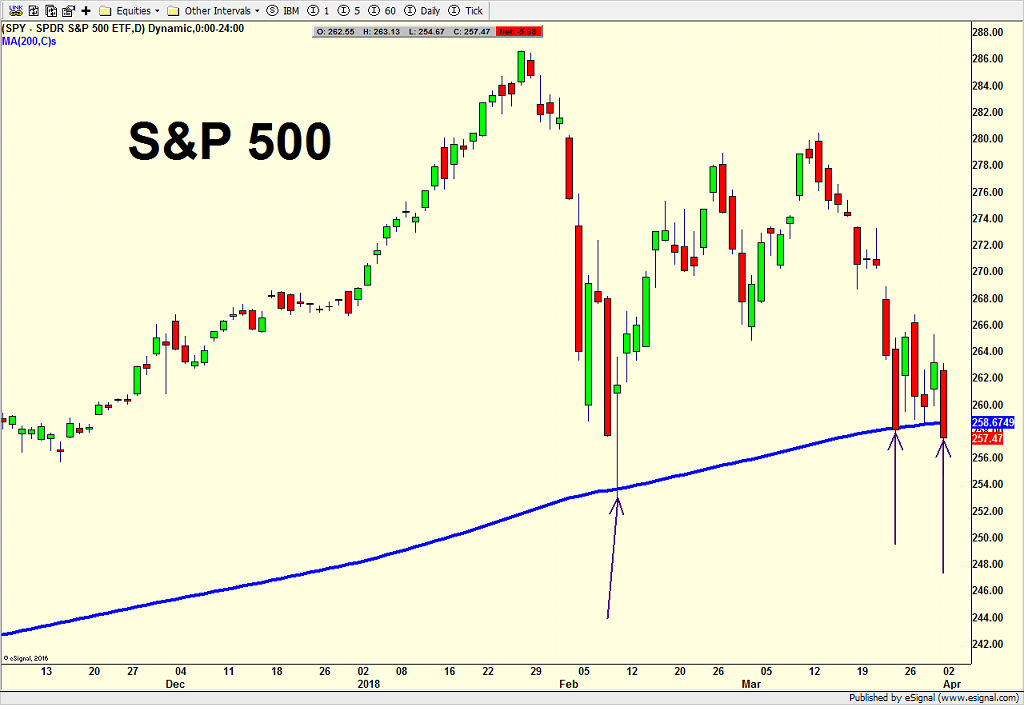
The S&P 500 is next and you can see three arrows where price visited its long-term trend. The one in early February, as I wrote then, seemed a bit too contrived for me and I was not convinced that the decline was over. With two more touches lately, it certainly seems like there should be a little more downside coming before the bottom is in.
The S&P 400 is next and at the low in February you saw multiple touches of the 200 day. That was one reason why I thought this group could lead coming out of that low.

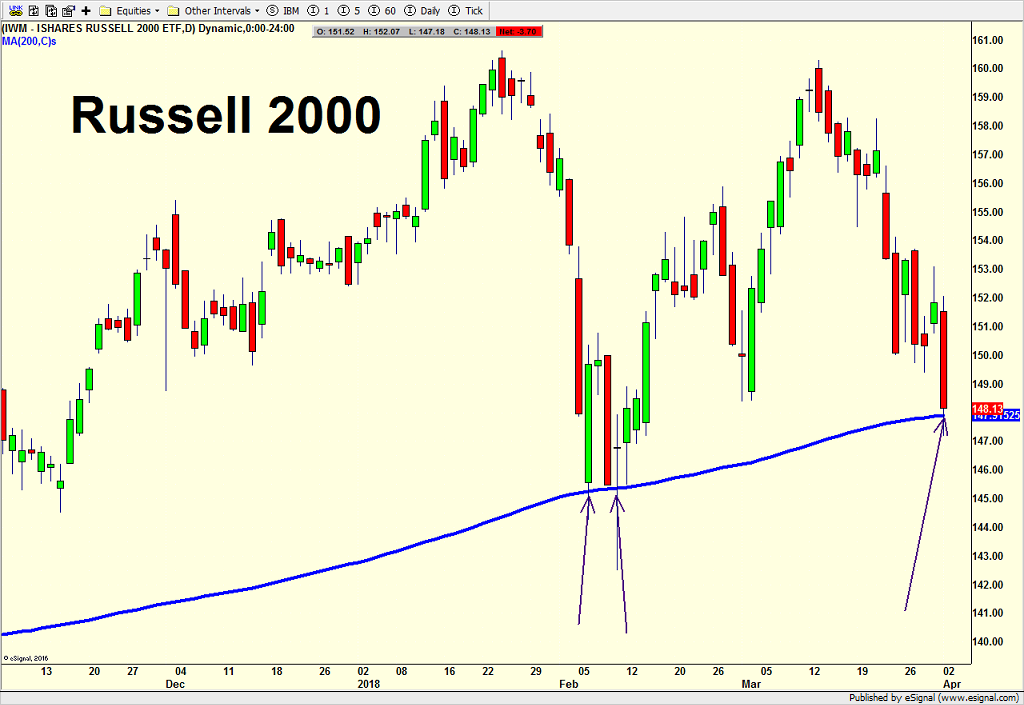
The Russell 2000 is below and it behaves similarly to the S&P 400. I thought this small cap index would lead coming out of the bottom and it performed really well into mid-March. As with the S&P 400, so far, it has remained well above the price levels seen in early February, a good sign for the intermediate-term once short-term stability returns.
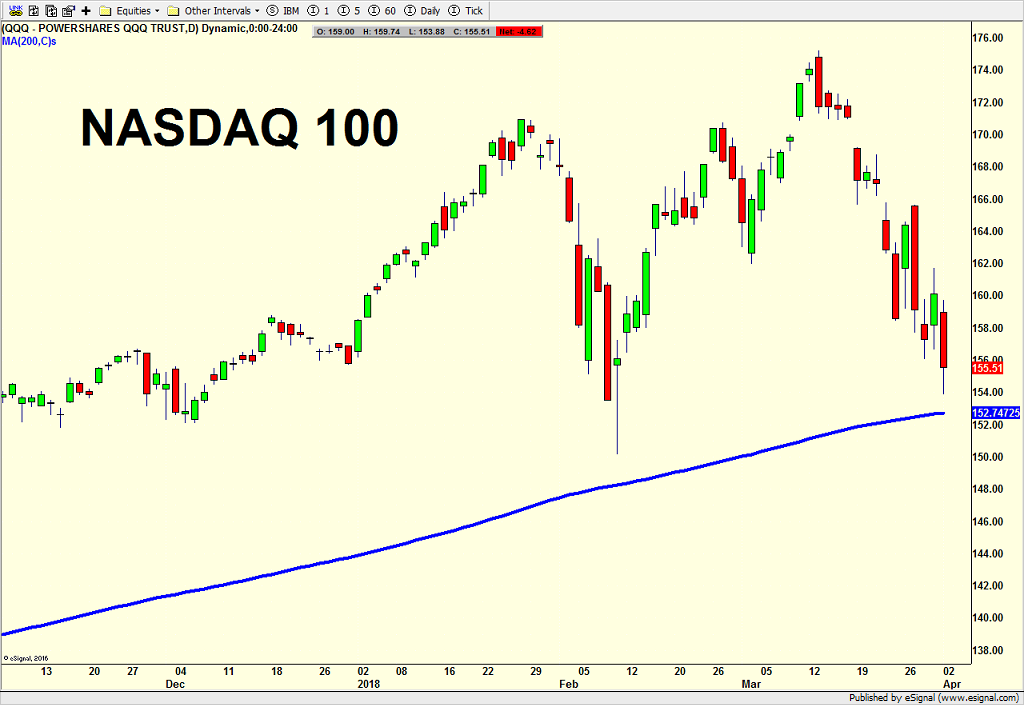
Finally, the NASDAQ 100 is last and to most people’s surprise, this tech-laden index has yet to test its 200 day trend although you certainly wouldn’t know it based on the commentary from the pundits and media with the Facebook controversy. It seems like every day all we hear about is the tech collapse and tech bubble being burst and the end of tech. Reality over rhetoric says that not only has the technology sector not touched its long-term trend yet, but it is also holding above the price levels seen in early February.
I am going to stop right here with the charts and the 200 day moving average. I think you get the picture. It’s always helpful to know where that line stands so you understand that “curious” behavior can occur around those price levels. If prices stayed below their long-term trend and the long-term trend was declining, well, that would be a bear market.
