Volatility At Historic Highs – Comparing Other Crashes
There is so much to write about today, but I think I will table most of it and do another video this week.
I want to start with the volatility which is at historic levels. Spikes like you see below in the chart of the VIX are almost always terminal, meaning the moves go straight up and die. I don’t want to say “never”, but I can’t find nor recall any period in history where the VIX spiked and remained high in a plateau. When volatility spikes, the stock market typically finds a high intensity bottom shortly thereafter. A move to 60 like we just saw certainly qualifies as an historic spike and one that indicates stocks are close to a bottom. As I mentioned the other day, I thought the stock market would bottom this week.
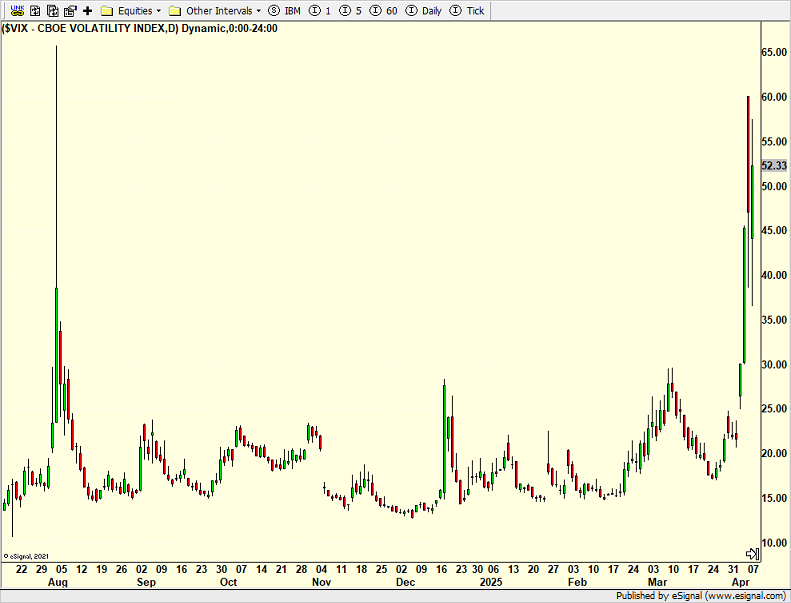
The challenge is that volatility this high makes day to day, hour to hour and minute to minute moves with enormous magnitude. The markets are opening up and down several percent each day and then moving several percent more each day, unnerving many investors. Until the VIX settles back down below 30, we can expect more volatility like this.
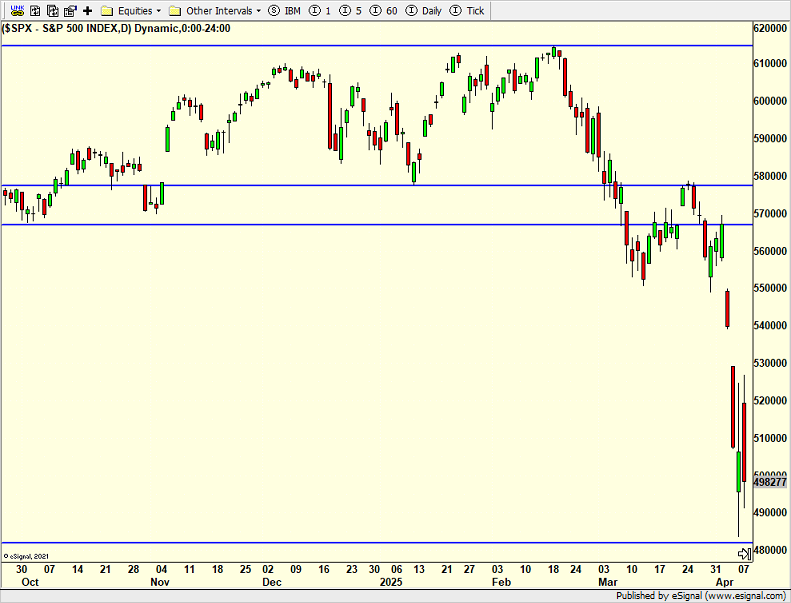
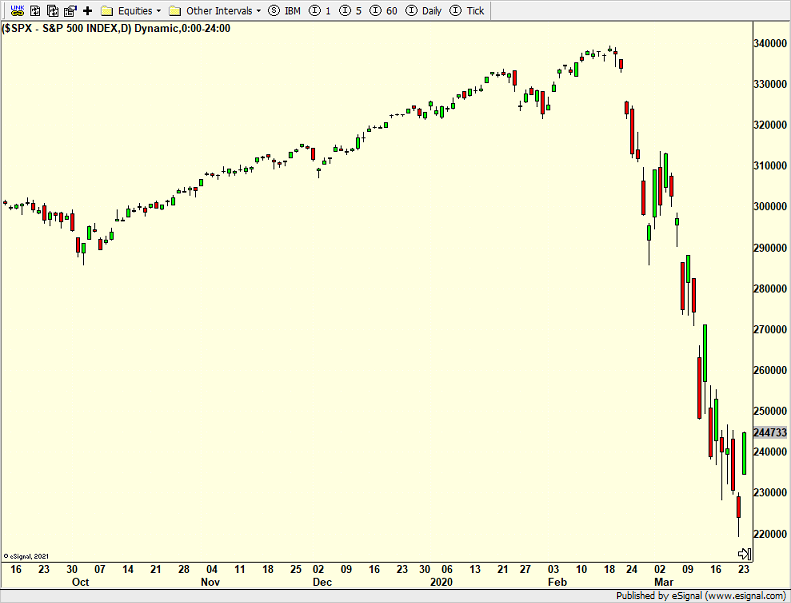
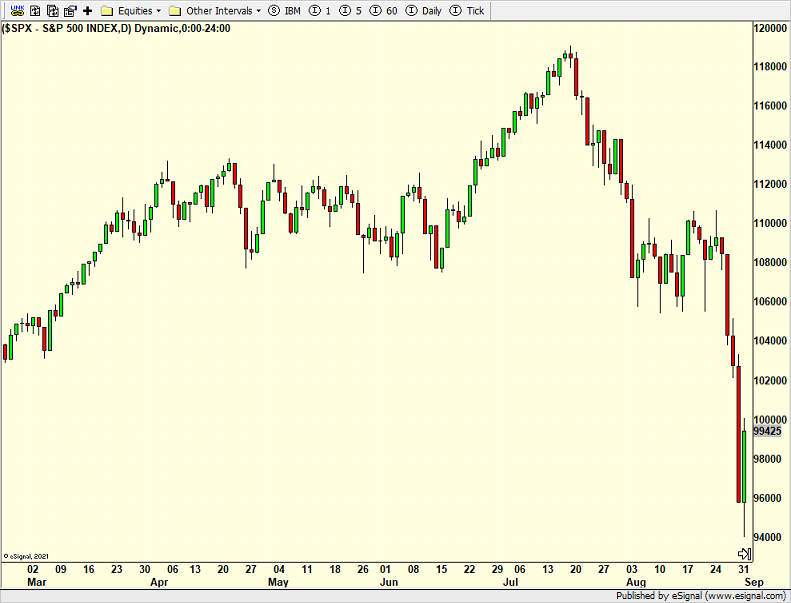
I received a number of emails asking what this current waterfall declines most resembles. I tried lining up the COVID crash with today. 2020 was deeper and quicker than today, at least so far.
I am also adding 1987 below.
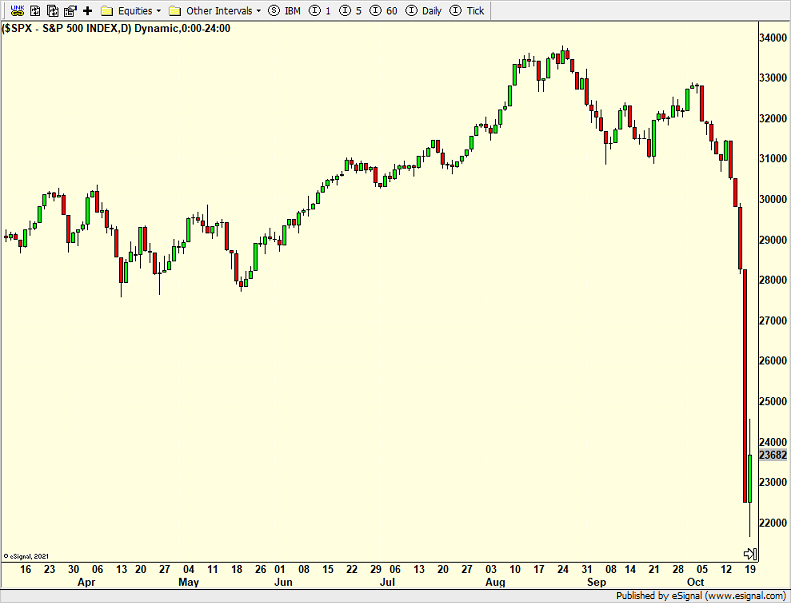
Today’s decline is at day 34 and the highest intensity may be over. COVID’s decline ended at 23 days. From the August peak in 1987 the decline lasted 38 days. The 1998 decline lasted 30 days which is below.
On Tuesday we bought SSO, more MQQQ, QLD and UWM.
